TechDev Newsletter - Market Update Issue #54
What the global risk cycle is saying. And a full alt market update.
Things are truly starting to look exciting. Today, we’re diving into some aspects of the global liquidity cycle that I’ve never shared before - insights that highlight why the macro environment is setting up perfectly for the next major leg up in the crypto market.
In addition, I’ll be providing key updates on important alt tickers and discussing why they’re showing clear confluence with the broader market setup. The alignment between the alt market and the global risk cycle points to a coordinated move.
IMPORTANT: Before getting to today’s content, I want to inform all members of an upcoming price adjustment for both the monthly and annual subscription options. After careful consideration of the time investment this newsletter requires and its impact on my work/life balance, this adjustment is necessary. I do not anticipate making another change for at least a year.
As we approach what I believe will be the leg that propels this market into euphoria, it’s become clear that I need to be more intentional with my time and focus. The coming months will demand an even greater effort to tune out the noise and concentrate on delivering value. With that in mind, I’ve made the decision to stop posting on Twitter.
This time, it’s permanent and more severe than past cutbacks. Going forward, all of my chart content and important insights will be shared exclusively through this newsletter.
I understand there are other paid crypto market resources available - some more expensive, some less. My goal has always been to price this publication as fairly as possible while ensuring it provides exceptional value. Thank you for your understanding and continued support.
Effective Wednesday, September 25th, the new subscription prices will be:
Monthly: $29
Annual: $249
Please note that your current subscription price will remain the same until your next billing cycle (whether monthly or annual) ends.
Starting with the next issue, we’ll resume polling readers to choose new altcoins for charting and target analysis.
I sincerely appreciate your continued support. If you have any questions, feel free to reach out by simply replying to this email.
Today’s topics
Bitcoin
Weekly Bitcoin Chart
CN10Y*M2
CNYUSD
Global M2
Altcoins
USDT.D
BTC.D
OTHERS
Bitcoin
Weekly Bitcoin Chart
The RSI has built a bottoming structure right where it needed to and is now showing early signs of reversing into the next leg. We’re also at the same number of weeks from the prior impulse top as we were when the all-time high breakout began during the 2014-2017 period.
Looking more closely, we can see the potential for an RSI breakout forming. Compare this to the last time we saw a similar setup in the yellow zone. Then, the breakout in RSI was a key indicator of the larger market shift that followed.
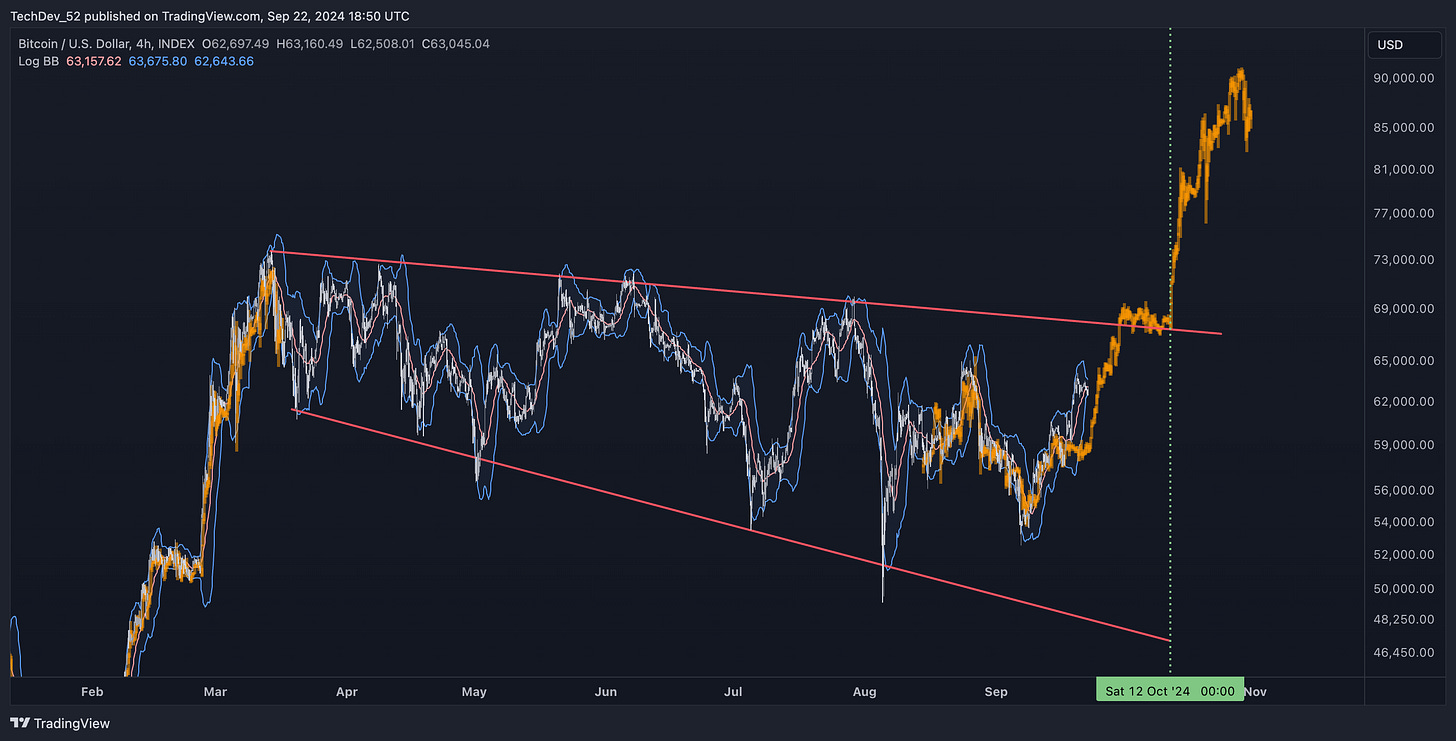
Zooming in further, this is the lower timeframe structure I am expecting.
With confluence, that outlook puts a final consolidation against the upper trend line where it would be expected.
I’m eyeing mid-October for the breakout from this exhausting correction. On the high timeframe, is has formed a literal horizontal line on the high timeframes.
I’ll keep an eye on any potential deviations from the expected orange path and provide updates if we see any shifts.
CN10Y*M2
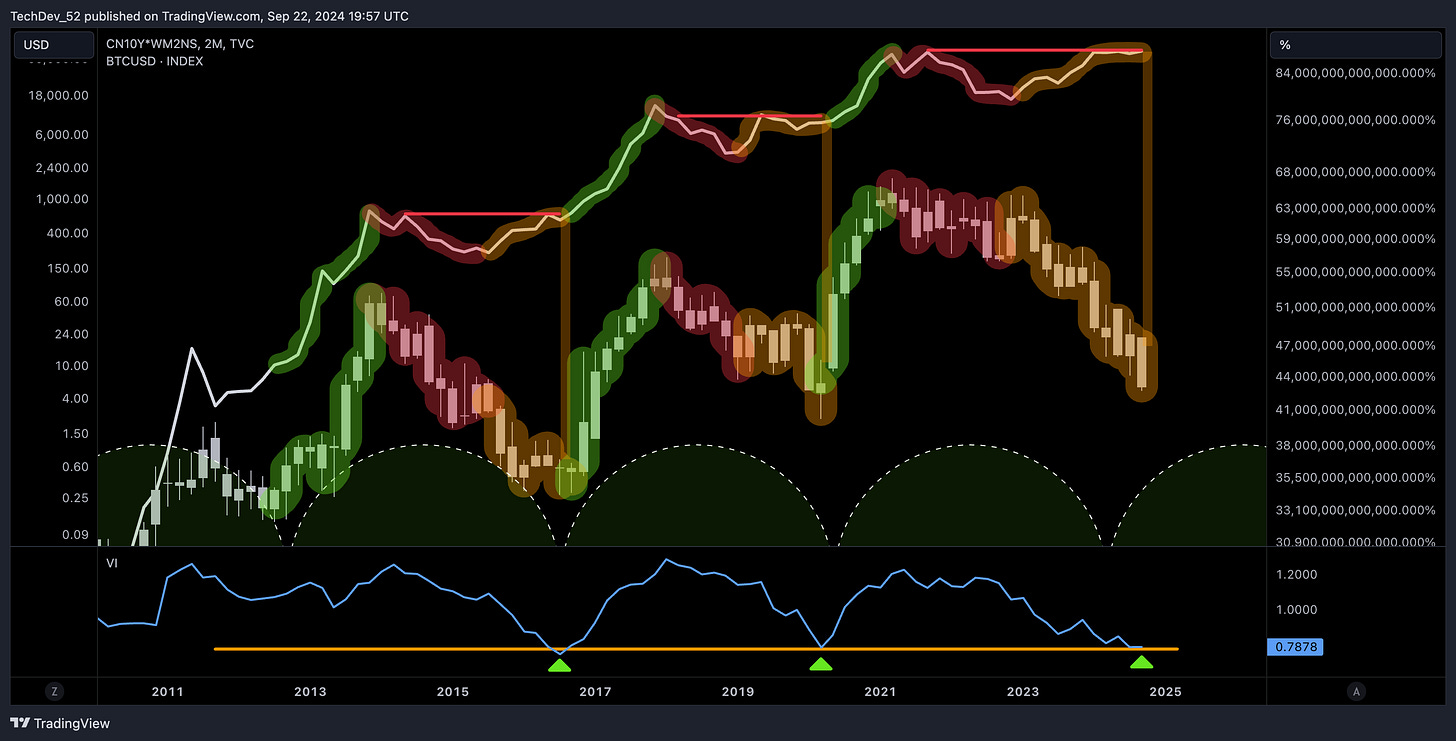
Let’s dive back into the global risk/liquidity cycle, starting with the CN10Y*M2 tracker. We’ve established the 3.75-year cycle timing, along with the familiar green, red, and orange phases. If we look closely at the transitions from orange to green in past cycles, they’ve consistently occurred just as the price consolidates against the B-wave high following the last macro impulse top.
What’s even more telling is the 2-month VI- line, which is now bottoming at the same level it has during the last two major cycle shifts.
So if the thesis is that the CN10Y cycle will reverse, can we find a related signal that foretells this future?
CNYUSD
It turns out that the strength of the Chinese Yuan against the USD has done just that. Looking at its relation to Bitcoin, the last three downtrends were marked by a 34-degree diagonal.
Each breakout from this pattern correlated with a major reversal in CN10Y*M2, and we’re seeing the same setup now. In each case, a steep Bitcoin leg followed. We’ll dive deeper into the timing of this potential top later.
Global Money Supply
Another clear indication of this cycle, and its connection to Bitcoin, comes from the global M2—an aggregation of the M2 money supplies of all major central banks. What do we see? Once again, the familiar 3.75-year cycle emerges. Historically, its tops have lagged behind Bitcoin’s macro USD highs by several months.
Should this move align with my Q1 2025 top thesis, it would likely bring about another “double top” scenario, similar to what we saw in 2021. However, if the cycle develops into a slower, smoother parabola, we could be looking at a more severe blowoff top later in 2025. For a more detailed discussion on top timing and targets, see this issue.
Altcoins
Now, let's shift to a comprehensive review of the altcoin market. We’ll incorporate the major metrics that track its overall pulse, giving us a clearer picture of where things stand and where they’re headed.
USDT.D
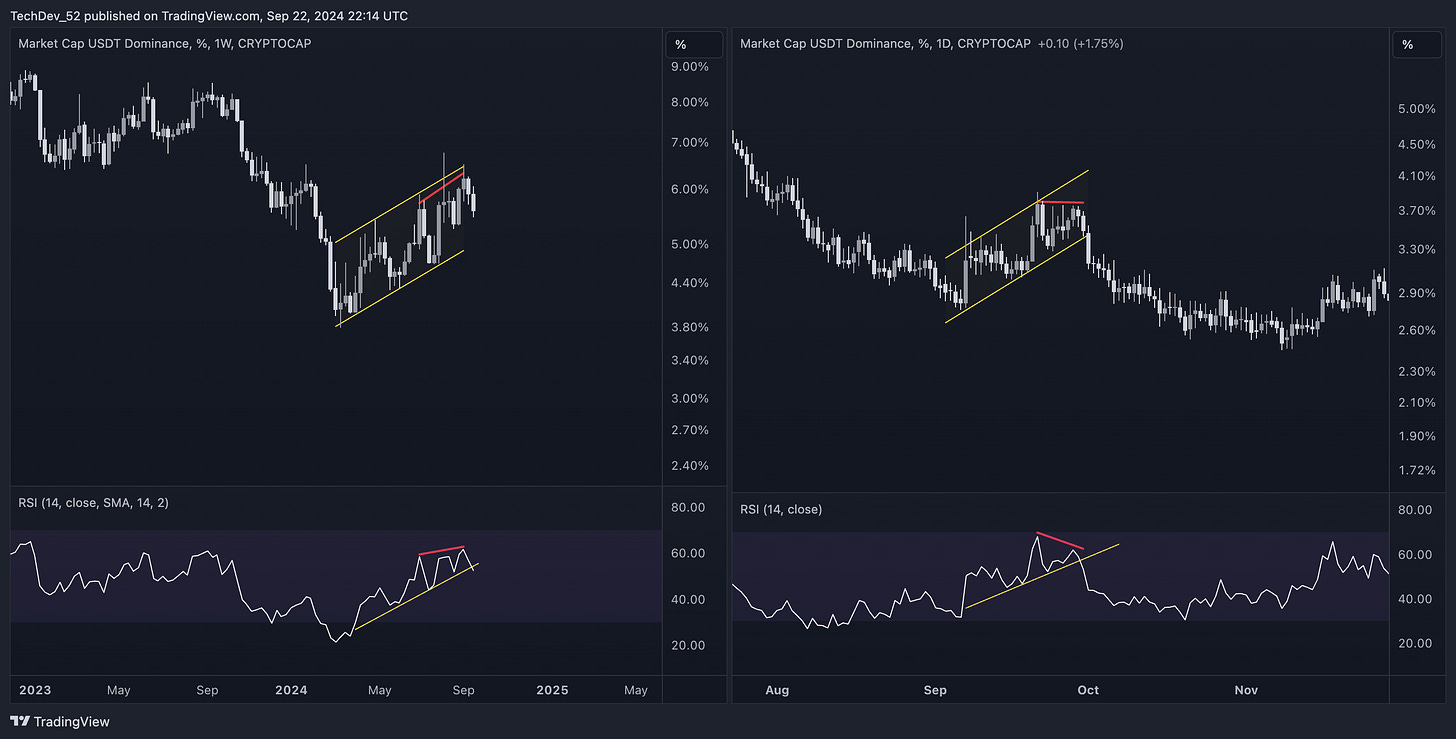
First up is Tether dominance. Here’s the macro distribution pattern we’ve been tracking. Whether you interpret this bear flag as the shorter red move in the illustration (part of Phase E) or further down the diagram out of view (post-Phase E), it is a bear flag either way. This structure suggests that further downside is likely ahead for Tether dominance, which means a major breakout in crypto.
One key indicator we’ve been tracking to signal an imminent breakdown in Tether dominance (and a breakout in crypto) is the weekly RSI trend line. Right now, we’re on the verge of seeing that line break.
OTHERS
Now, turning to the OTHERS index, here’s the picture I shared a few months ago. At that time, I expected a move down to the yellow trend line, which aligned with the top of the blue section. I also anticipated a break below the yellow price trend line, targeting the 0.382 before any significant expansion could begin.
Here’s what we’ve seen so far: RSI is attempting to bottom out right on the yellow trend line, aligning with a test of the blue zone as expected. Meanwhile, the price has broken below the yellow trend line and made its way to the 0.382 level. Everything is falling into place, setting the stage for the next leg of altcoin expansion.
OTHERS/BTC
Next, let’s look at OTHERS/Bitcoin on the 2M chart. We see a clear correlation cycle that tracks well with the green, red, and orange phases. A breakout above the mid level historically marks the start of the green phase - altcoin expansion.
Pay close attention to the VI+ line structure. Each time it bounced off the bottom trend line, it coincided with the start of the green phase. What’s particularly interesting is that the altcoin market top occurred at the exact same 1.24 level on the VI+ line during both prior cycles, providing a reliable marker for altcoin cycle highs.
Closing
We’ve explored several critical factors aligning for a potential breakout in both Bitcoin and the broader crypto market. Starting with the global liquidity cycle, the CN10Y*M2 tracker and its historical 3.75-year rhythm are signaling that we are nearing a transition from the orange to green phase. This cycle timing, combined with technical indicators such as the 2M VI- line bottoming at key levels, strongly suggests we are at a pivotal moment similar to past macro cycles. Further, the strength of the Chinese Yuan against the USD and its historical relationship with Bitcoin is reinforcing the expectation of a significant CN10Y reversal, adding another layer of confluence to our thesis.
On the altcoin front, Tether dominance is continuing its bear flag structure, and the weekly RSI trend line is poised for a breakdown - signals that have historically marked market-wide breakouts. OTHERS has followed the path we predicted, with RSI attempting to bottom at critical levels and price hitting the 0.382 Fibonacci level. Against Bitcoin, OTHERS is showing clear correlation cycles on the 2M, with the VI+ line bouncing off the bottom trend line, suggesting the start of the green phase for altcoins.


Thanks for the input. At this point I think that most are looking for The google doc to be up dated with targets and strength. DMTR,RIO,FOFAR and ZEUS to name a few.
Hi TechDev, I would like to see more update on Alt Coins. In this addition, you have not share alt coin category types. Appreciate if you could share this as we do not want to miss out on buying altcoins at their bottom price. Also, do you believe that alt coins in your spreadheet has bottomed or further downside is expected before they go up for their last leg?