

Three weeks ago I told you the bottom appeared to be in, and the market has spent those three weeks agreeing. Bitcoin defended its double bottom just under $60K and is pressing the top of its box near $64K. Ethereum terminated in its band, reclaimed $1,850, and is now testing the line that has capped every recovery attempt since the correction began. The recovery I positioned for in Issue #96 is no longer a forecast, it is underway. What it is not yet is confirmed, and the difference between those two words is the spine of this issue. Today I will update the short-term paths for both majors, show you the single signal I am waiting on to call the bottom confirmed, walk through the engine and the ratio that both keep insisting we are living in a second-half-2020 mirror, and then hand you something new: the first Gem Score board, the sector-by-sector token groundwork I promised back in Issue #96, rebuilt as a scored, repeatable system.
Today’s topics
The Majors
Ethereum: The Recovery to the Line
Bitcoin: Exiting the Box
The Roadmaps
The Paths Through 2027
The Confirmation Signal: One Green Flip
The Engine
H2 2020, Not Late 2018
The Alt Ratio
ETH/BTC: Confluence with the Engine
The Gem Score
The Methodology
The Board
The Top Three
Sector Tailwinds
Closing
The Majors
Ethereum: The Recovery to the Line
Start with the structure we have been tracking for months, because it has done everything asked of it. The chart below compares the current leg against the analogous structure nested earlier in the same corrective fractal, with the orange overlay marking the analog we have followed since spring.
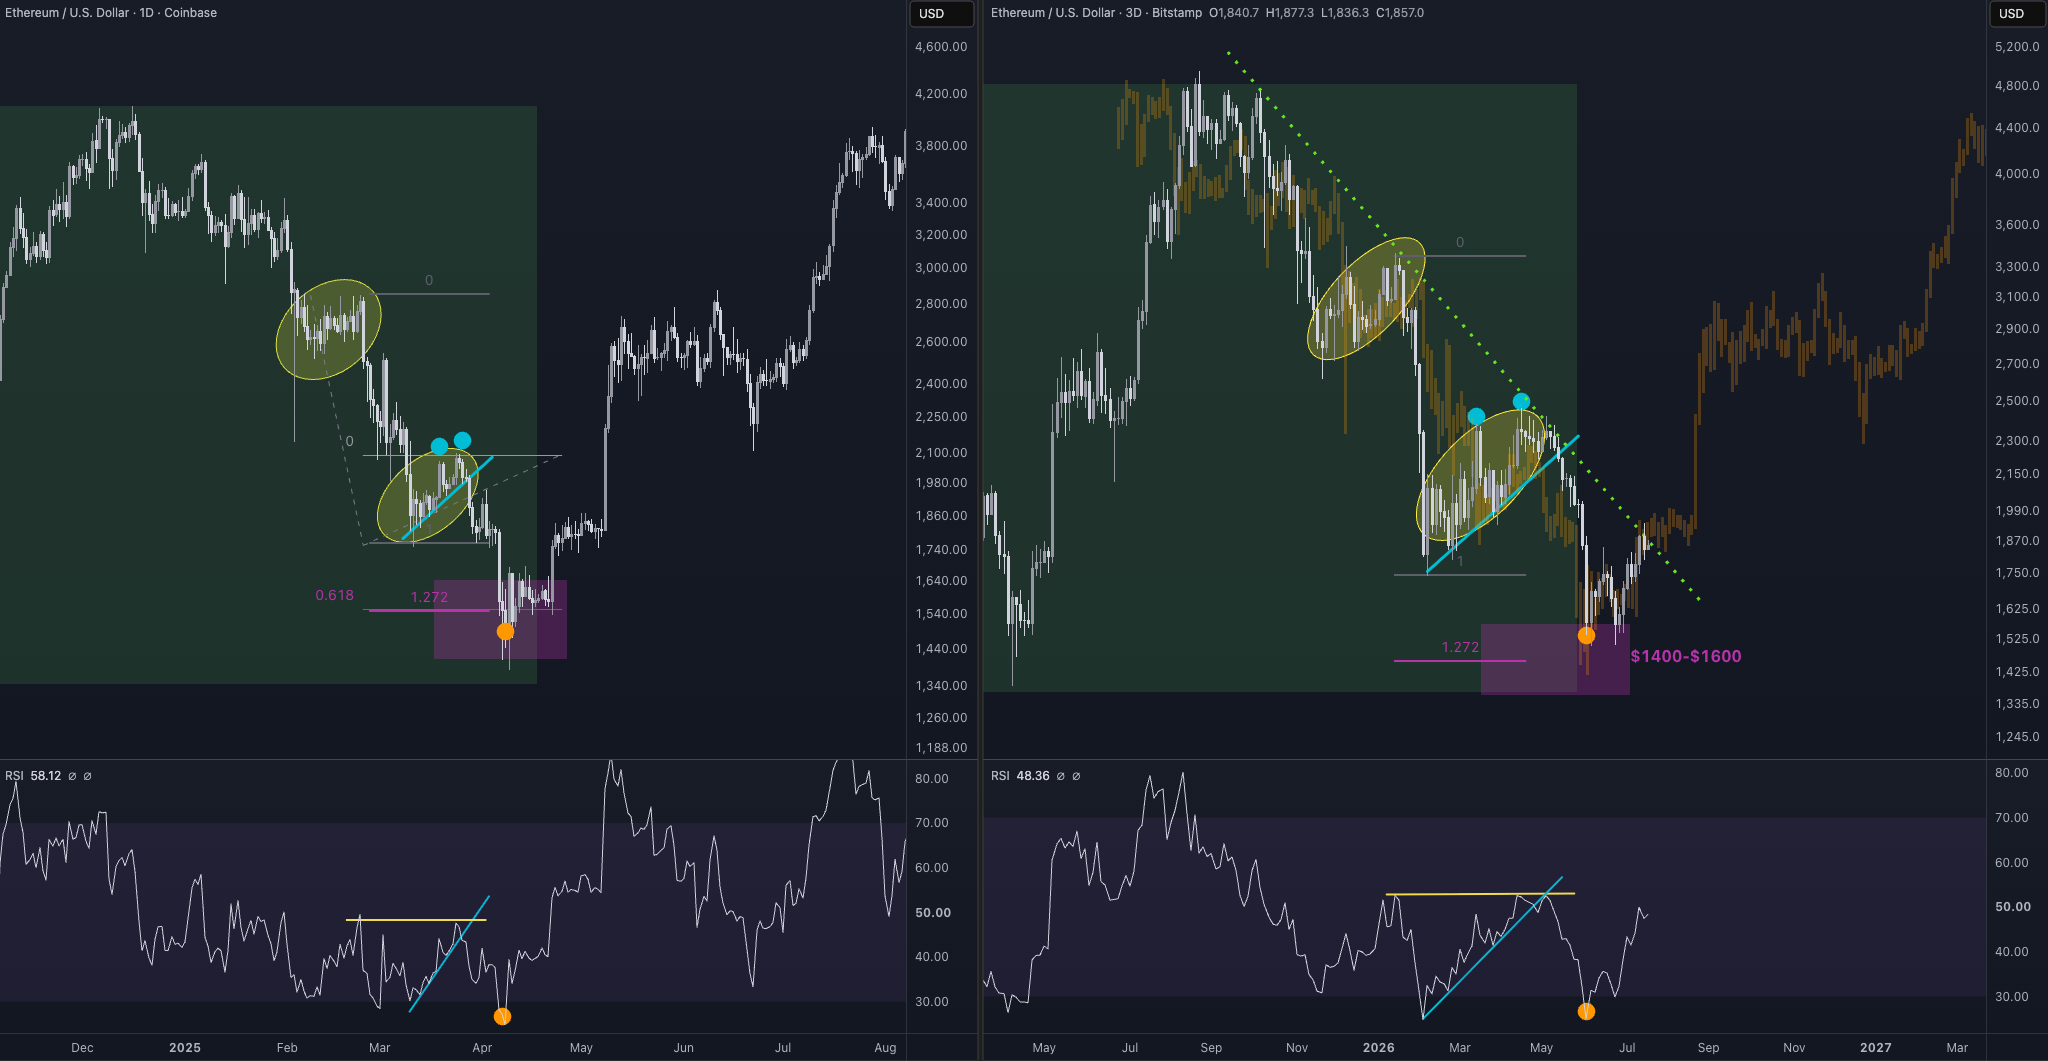
Back in May, in Issue #95, this fractal called for a final leg down from roughly $2,100 into the $1400 to $1600 band, and Ethereum printed $1505 on June 6, dead in the zone. The same work called for the recovery that would follow, and that recovery has now played out as well, which brings us to the line that matters. Price is pressing the green downtrend diagonal for the fourth time, and a diagonal this mature, tested this many times, is exactly where I expect the final consolidation of a recovery to form before the breakout comes. My read from here is a pause against the line, some backing and filling while the structure gathers itself, and then the break that opens the path toward the $2800 to $3400 zone, the first waypoint on the roadmap we will get to in a moment.
Bitcoin: Exiting the Box
Bitcoin has been running the same playbook one step behind, and the chart below shows it against the same Ethereum fractal reference we used to project it.
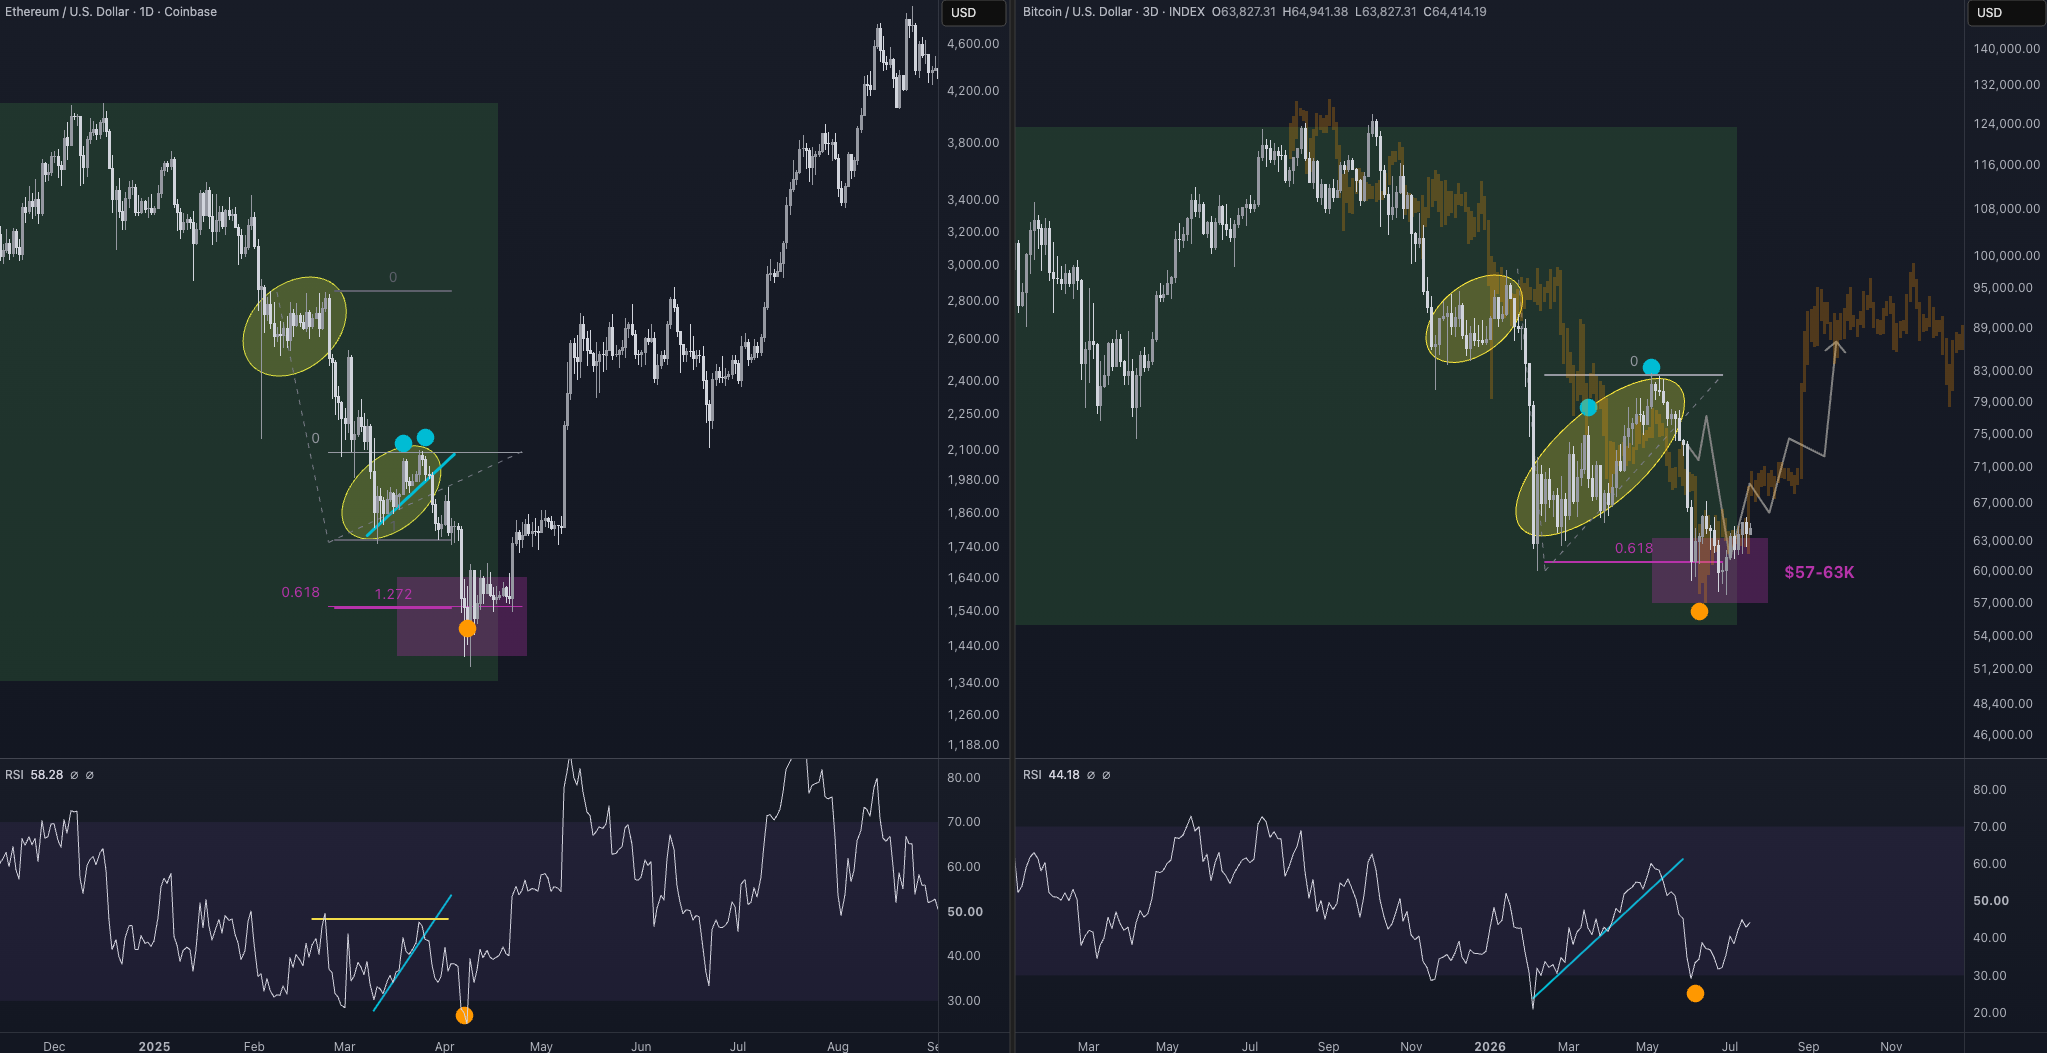
In May the call was a breakdown from the high 70Ks into the $57K to $63K box, and Bitcoin printed $59K on June 5, inside the band, before turning. It has now nearly exited the bottoming phase entirely. Notice that Bitcoin is lagging Ethereum through this recovery, and understand that the lag is not a defect in the thesis. It is the thesis. It is the sequencing I have been positioning for all year, and it is precisely why ETH/BTC is outperforming, a point the ratio section will make structural shortly. From here I expect Bitcoin to surge into the low 70Ks and spend some time consolidating there, digest that move through another small consolidation, and then push into the 80Ks on the expansion that follows.
The Roadmaps
The Paths Through 2027
Now zoom all the way out, because this is the part I want you to sit with. The two charts below are the year-long roadmaps for Ethereum and Bitcoin that I introduced in Issue #95, drawn at the end of May while the final leg down was still unfinished. The pink paths have not been modified since. I have not redrawn them, I have not shifted a waypoint, and I do not intend to while the market keeps honoring them.
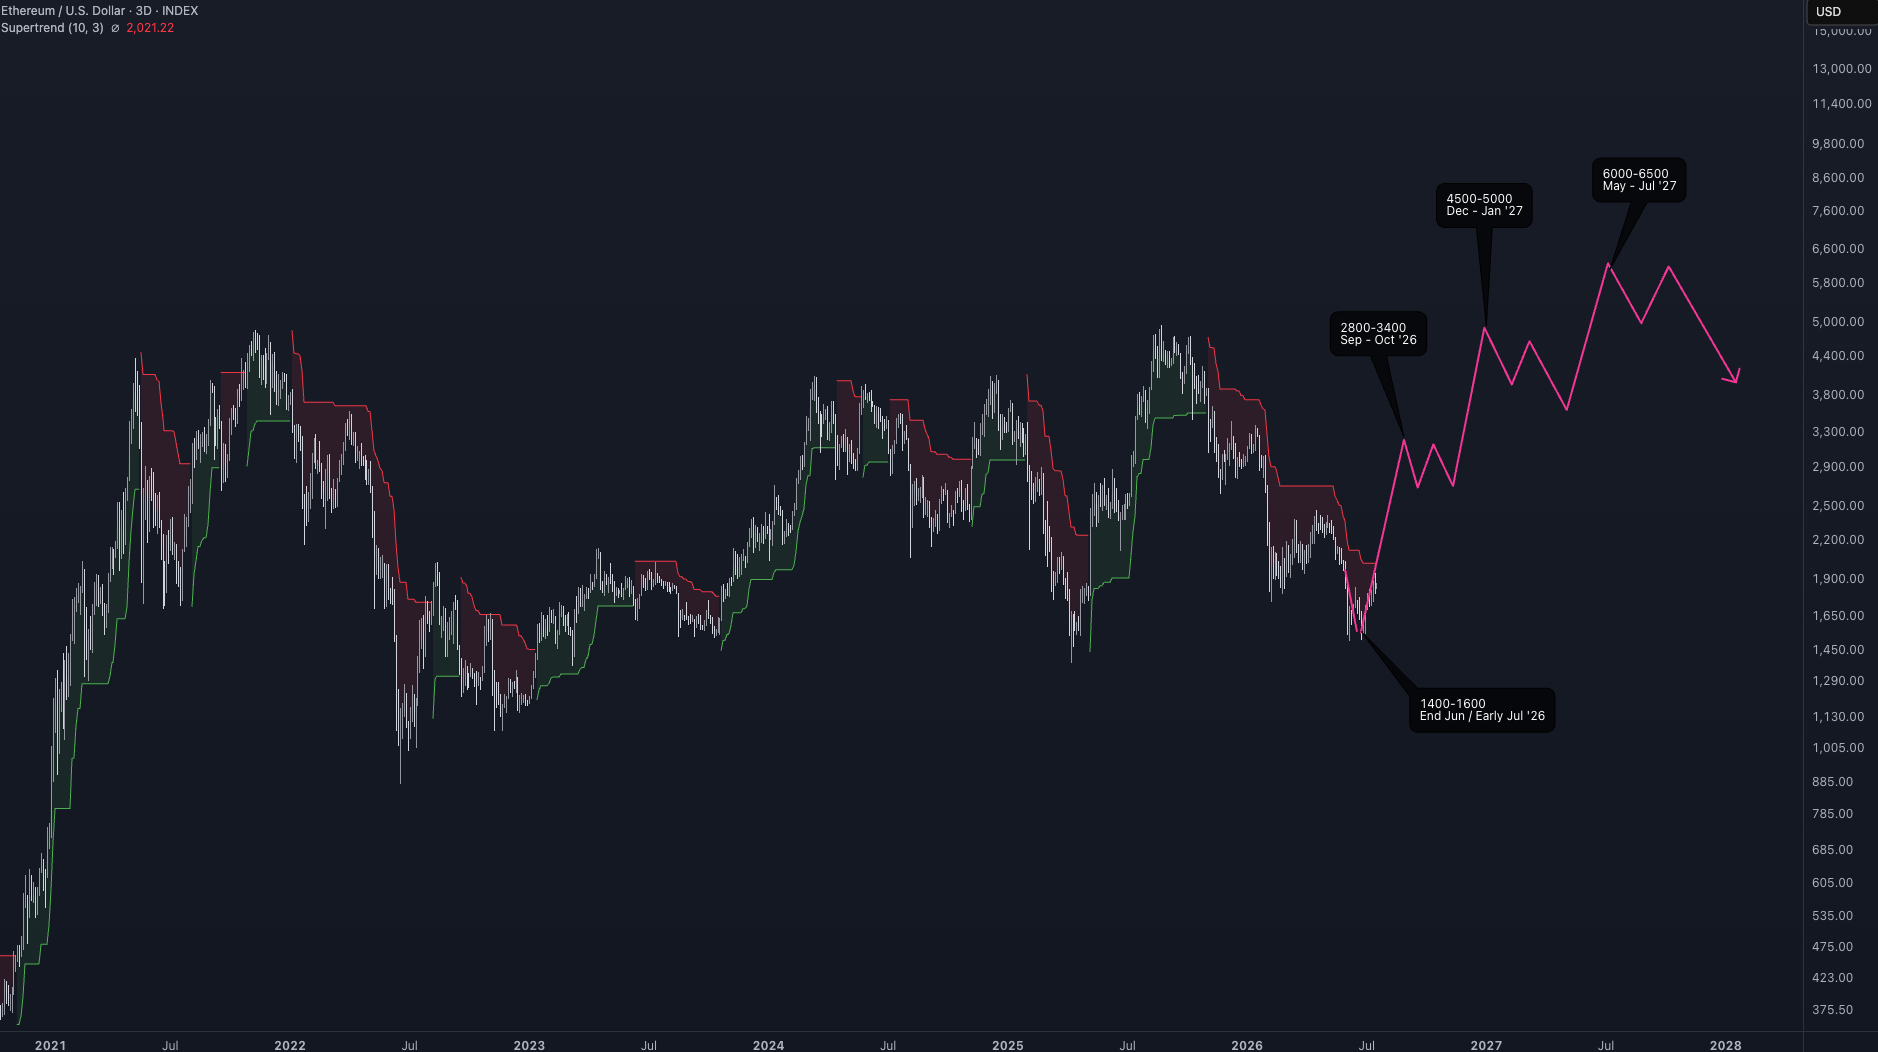
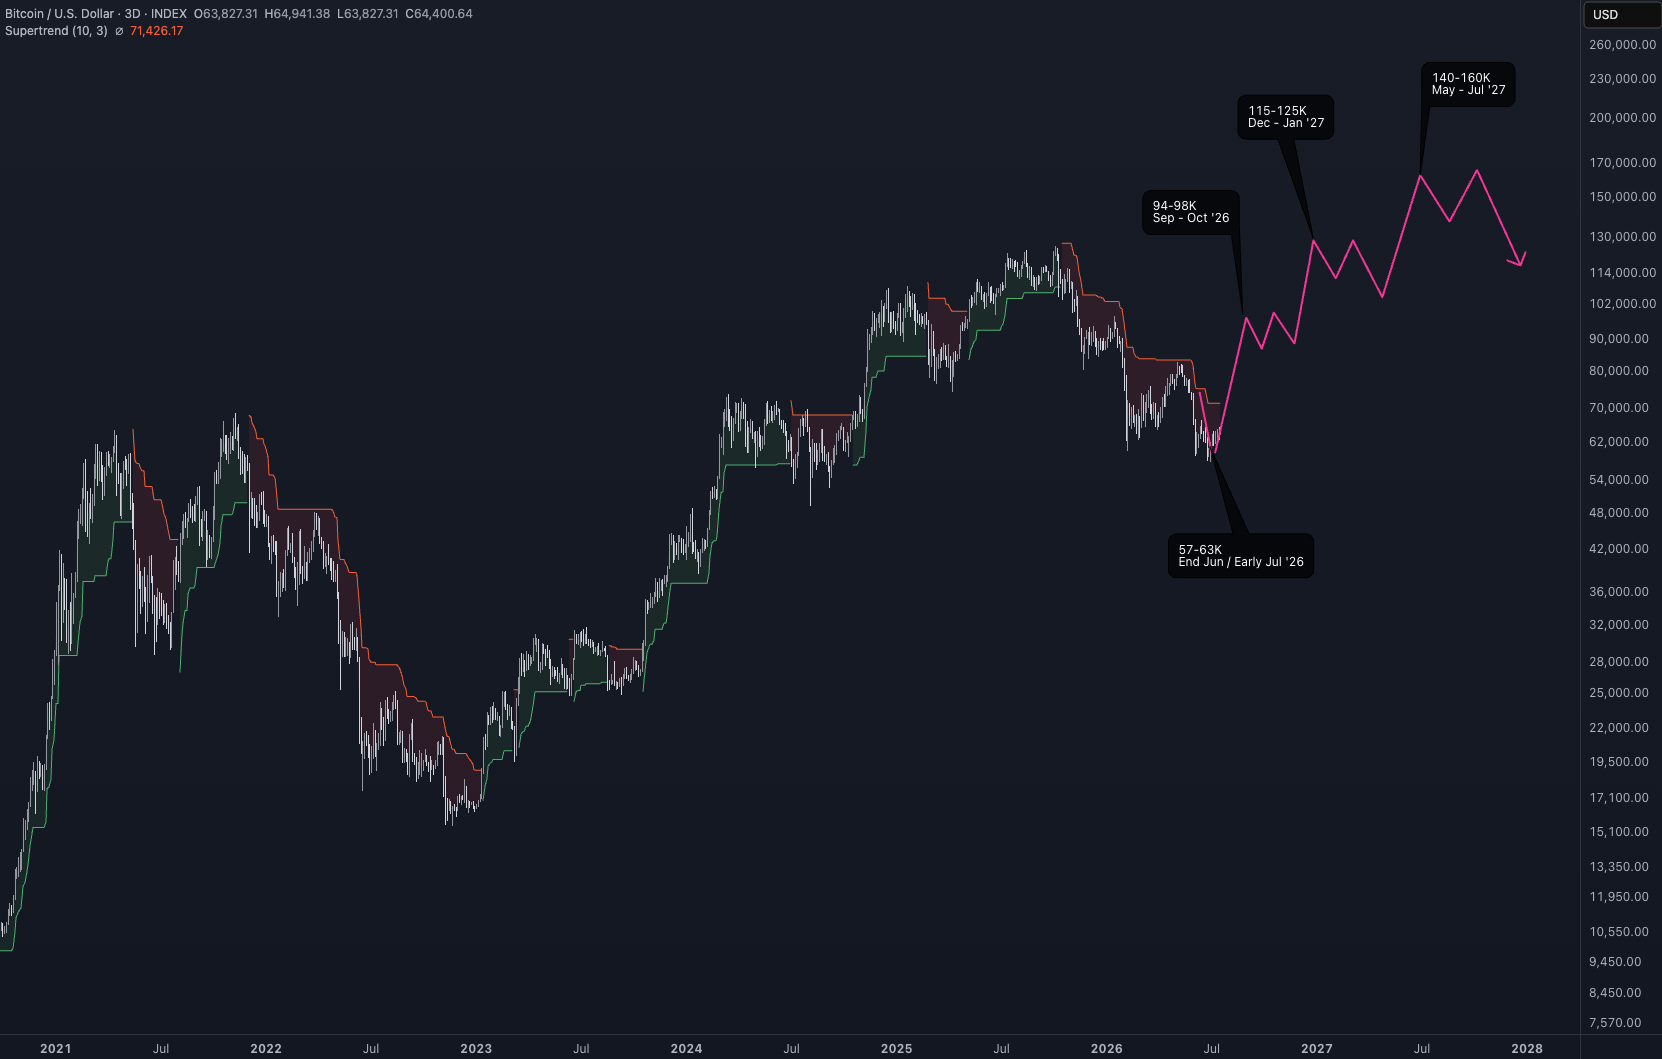
We bottomed where expected and when expected. Ethereum terminated in the $1400 to $1600 band in the end-of-June window the path called for, and Bitcoin did the same in $57K to $63K. The forward waypoints therefore stand exactly as drawn. For Ethereum, $2800 to $3400 in the September to October window, $4500 to $5000 into December and January, and $6000 to $6500 through the May to July stretch of 2027. For Bitcoin, $94K to $98K in September to October, $115K to $125K into December and January, and $140K to $160K by the middle of 2027. As I said when I drew them, this remains the conservative case, conditioned on the business cycle’s impulse running its historical ten to twelve months once it begins. When the market does exactly what the map said it would do, the correct response is not to redraw the map.
The Confirmation Signal: One Green Flip
So the bottom is in, in my strong opinion. But I want to be precise about the difference between conviction and confirmation, because you should know exactly what would graduate this call from one to the other, and it is sitting on the roadmap charts above. The signal is the 3-day Supertrend.
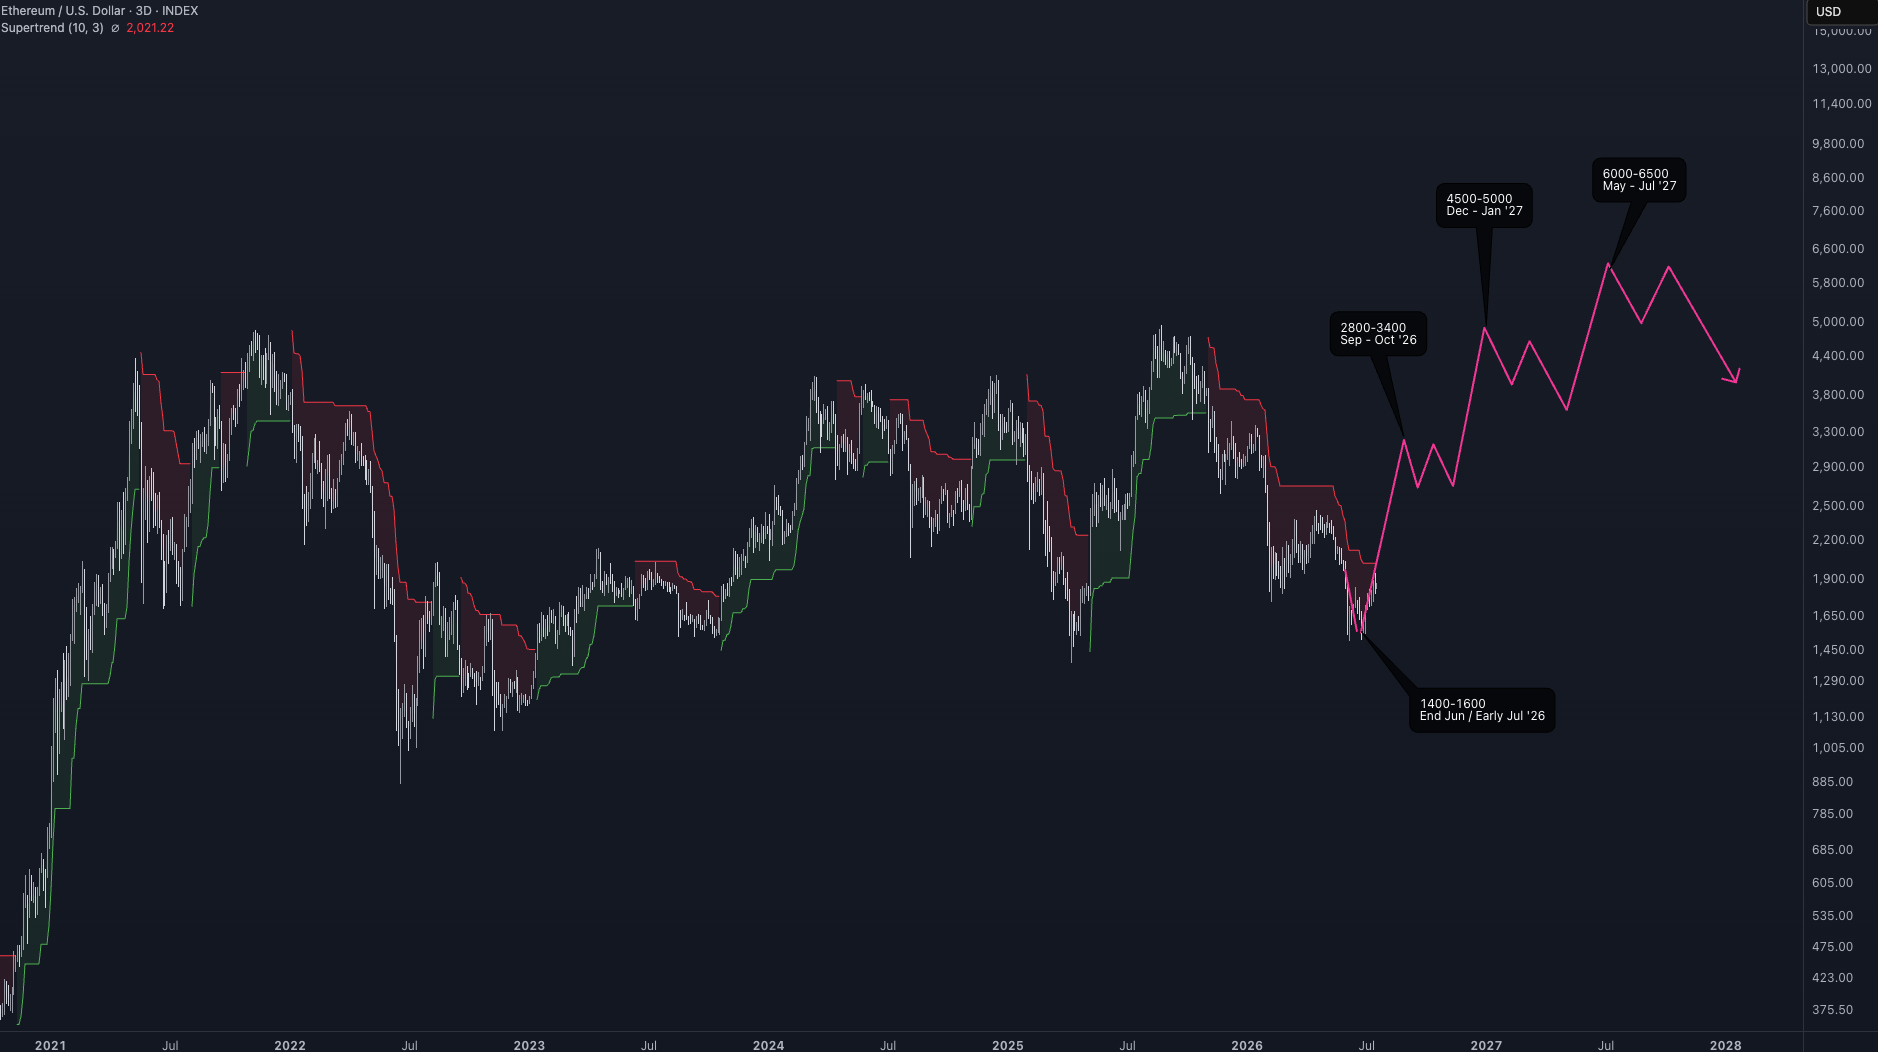
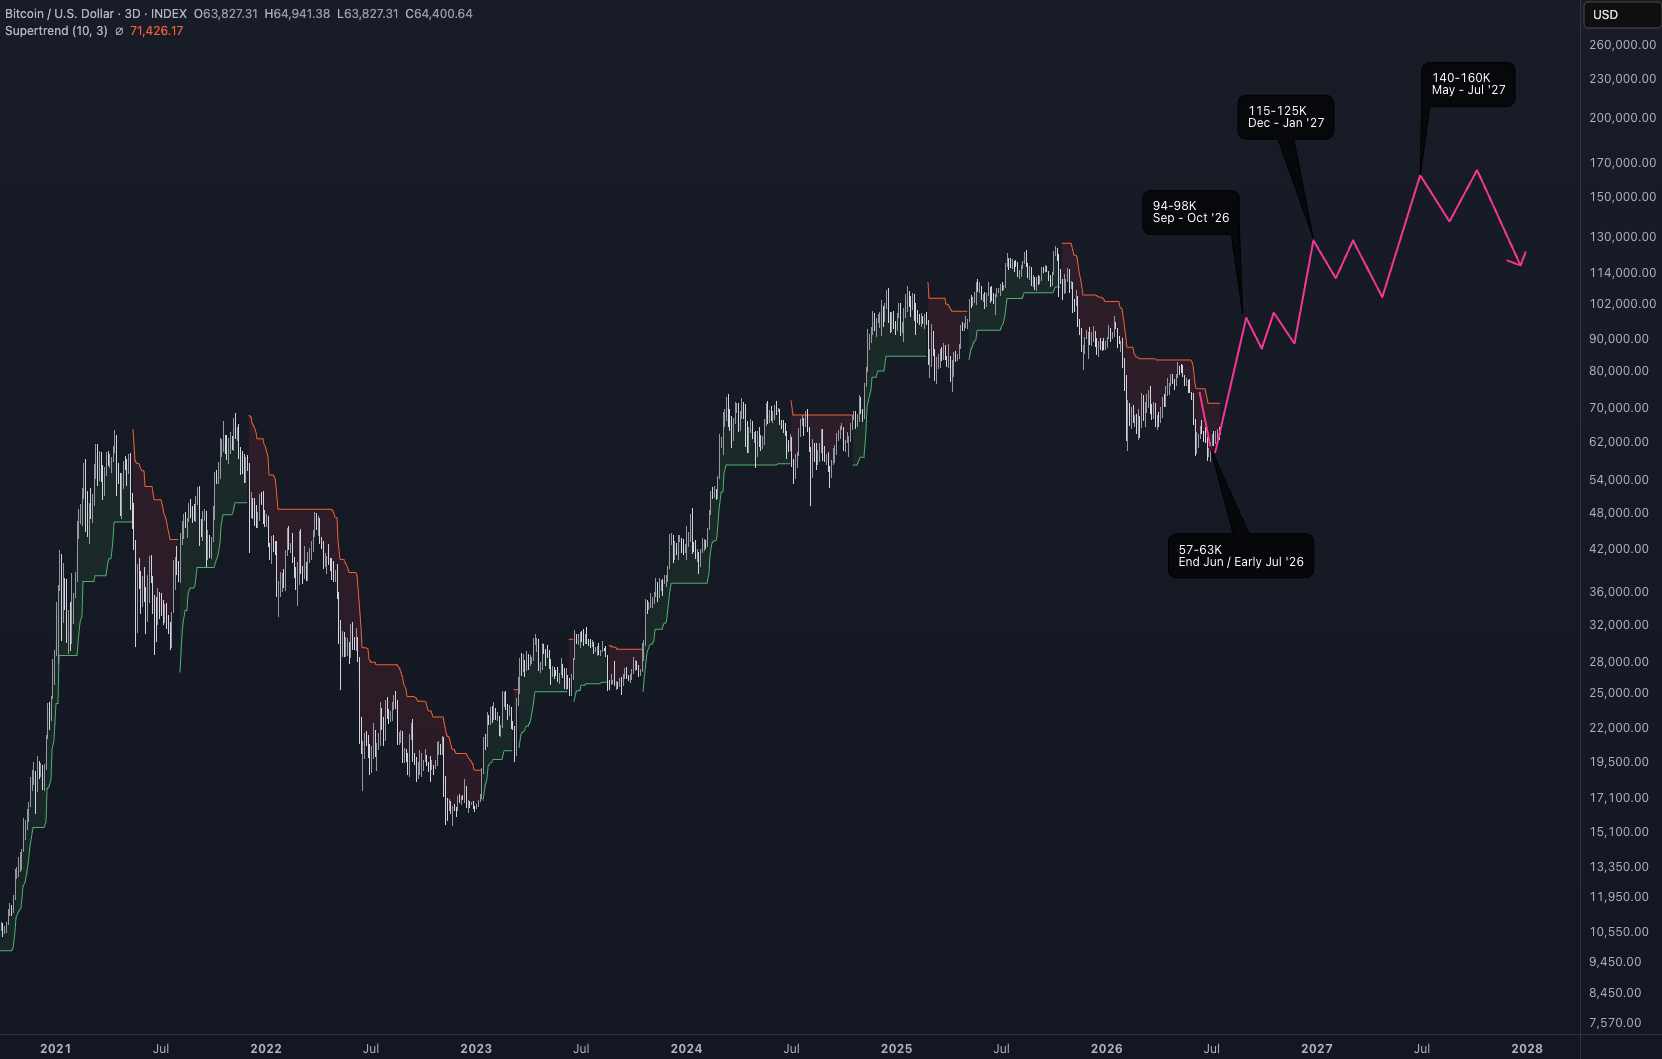
The 3-day Supertrend is the cleanest mid-timeframe trend filter I track. It does not catch exact lows, and it is not trying to. What it does is confirm that a trend has genuinely changed character, and its record at cycle turning points is what earns it this job: the late-2022 bear market bottom was confirmed by exactly this signal flipping green, well before most participants believed the turn was real. Both majors are still carrying red Supertrends from the correction, with the flip currently sitting at roughly $2,020 on Ethereum and roughly $71.4K on Bitcoin, and those levels will keep walking down toward price with every 3-day bar that passes. When those flips print green, and I anticipate they will on the strength that follows the consolidations described above, the bottom moves from strongly suggested to confirmed, and a few things in my own process unlock along with it. One of them is waiting for you in the closing.
The Engine
H2 2020, Not Late 2018
Underneath all of it, as always, is the business cycle, and this issue’s look at it is the most important context in the letter. Consider the chart below, the two-month copper over gold ratio multiplied by Chinese bank loan magnitude, the liquidity-weighted read of the global cycle that has framed this newsletter’s entire macro thesis.
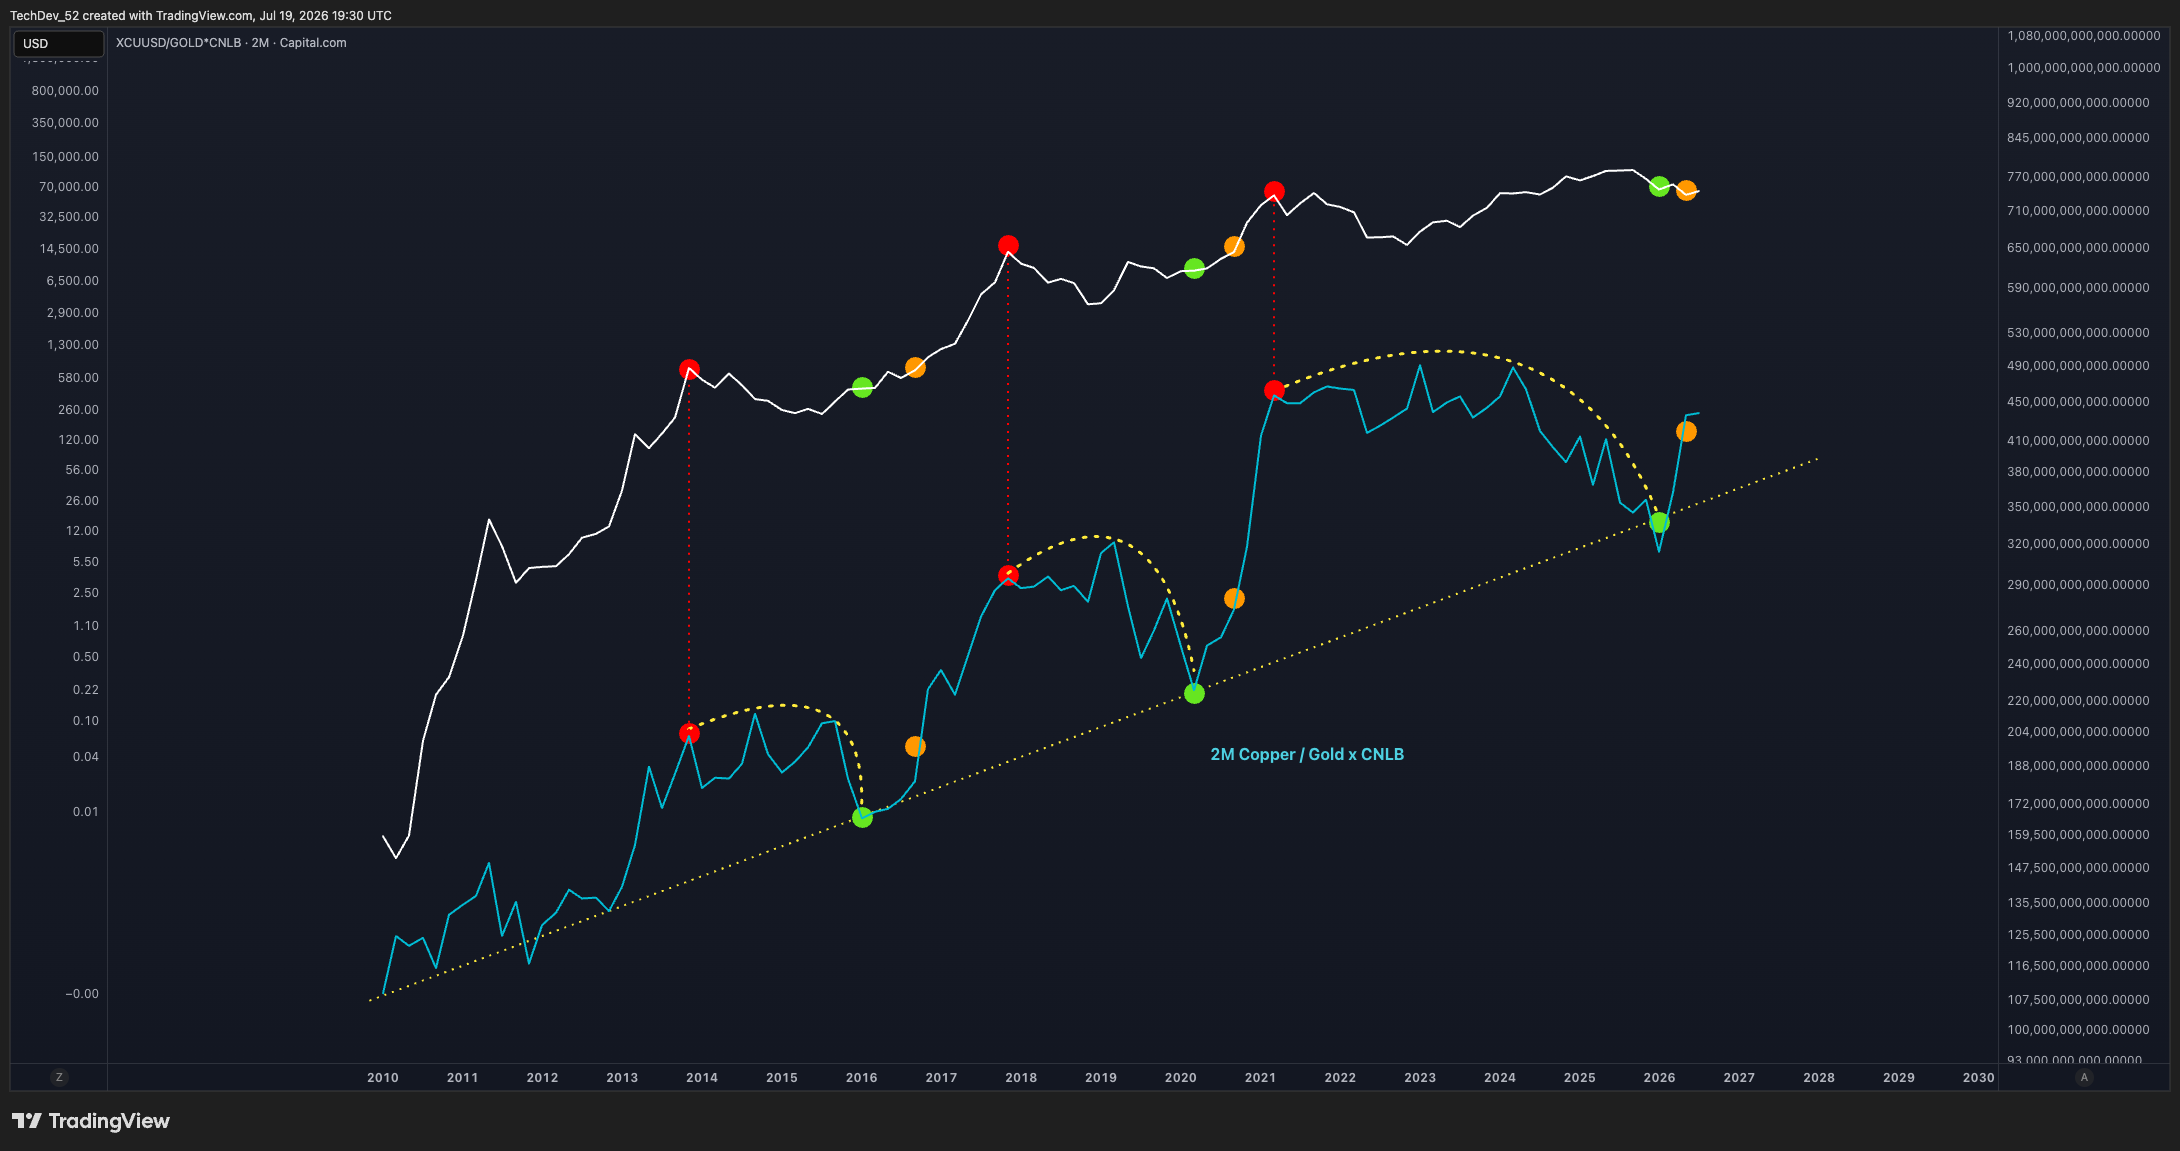
Recall the structure, because it has held for over a decade. The composite rounds over from its top in the yellow arcs, declines into the rising diagonal, resets against it at the green dots, and then elevates toward the orange points, and that elevation phase is what has coincided with the parabolic portion of every crypto cycle in this dataset. This is the primary reason I believe we have been inside one long macro cycle since 2021 rather than a completed cycle and a fresh one. Each cycle has rhymed with its predecessor, each has run on a slower clock than the one before it, and this reset took roughly two to three times longer to reach the diagonal than either of the prior two. That dilation is the whole story of the last three years. It is why the in-between felt endless, and it is why so many people gave up on the framework right before it resolved.
The resolution is now on the chart. The composite has reset to the diagonal, printed the green dot, and turned up off the line, and the parabolic portion of the crypto cycle has historically begun from just about where we are sitting now, as the line elevates away from the green dot and climbs toward the orange. And this is the read I want you to internalize, because it changes how you should be positioned emotionally as much as financially: on this chart, our position looks far more like the second half of 2020 than the end of 2018. The bottom is behind us, the elevation is beginning, and the impulse is ahead. For those who want to watch it live rather than wait two weeks for my next update, I am including access to the live business cycle chart here, available to members:
Live TradingView chart links are for paid subscribers.
The Alt Ratio
ETH/BTC: Confluence with the Engine
If the engine says second half of 2020, the ratio chart says it louder, and if you take one thing from this issue, take this chart.
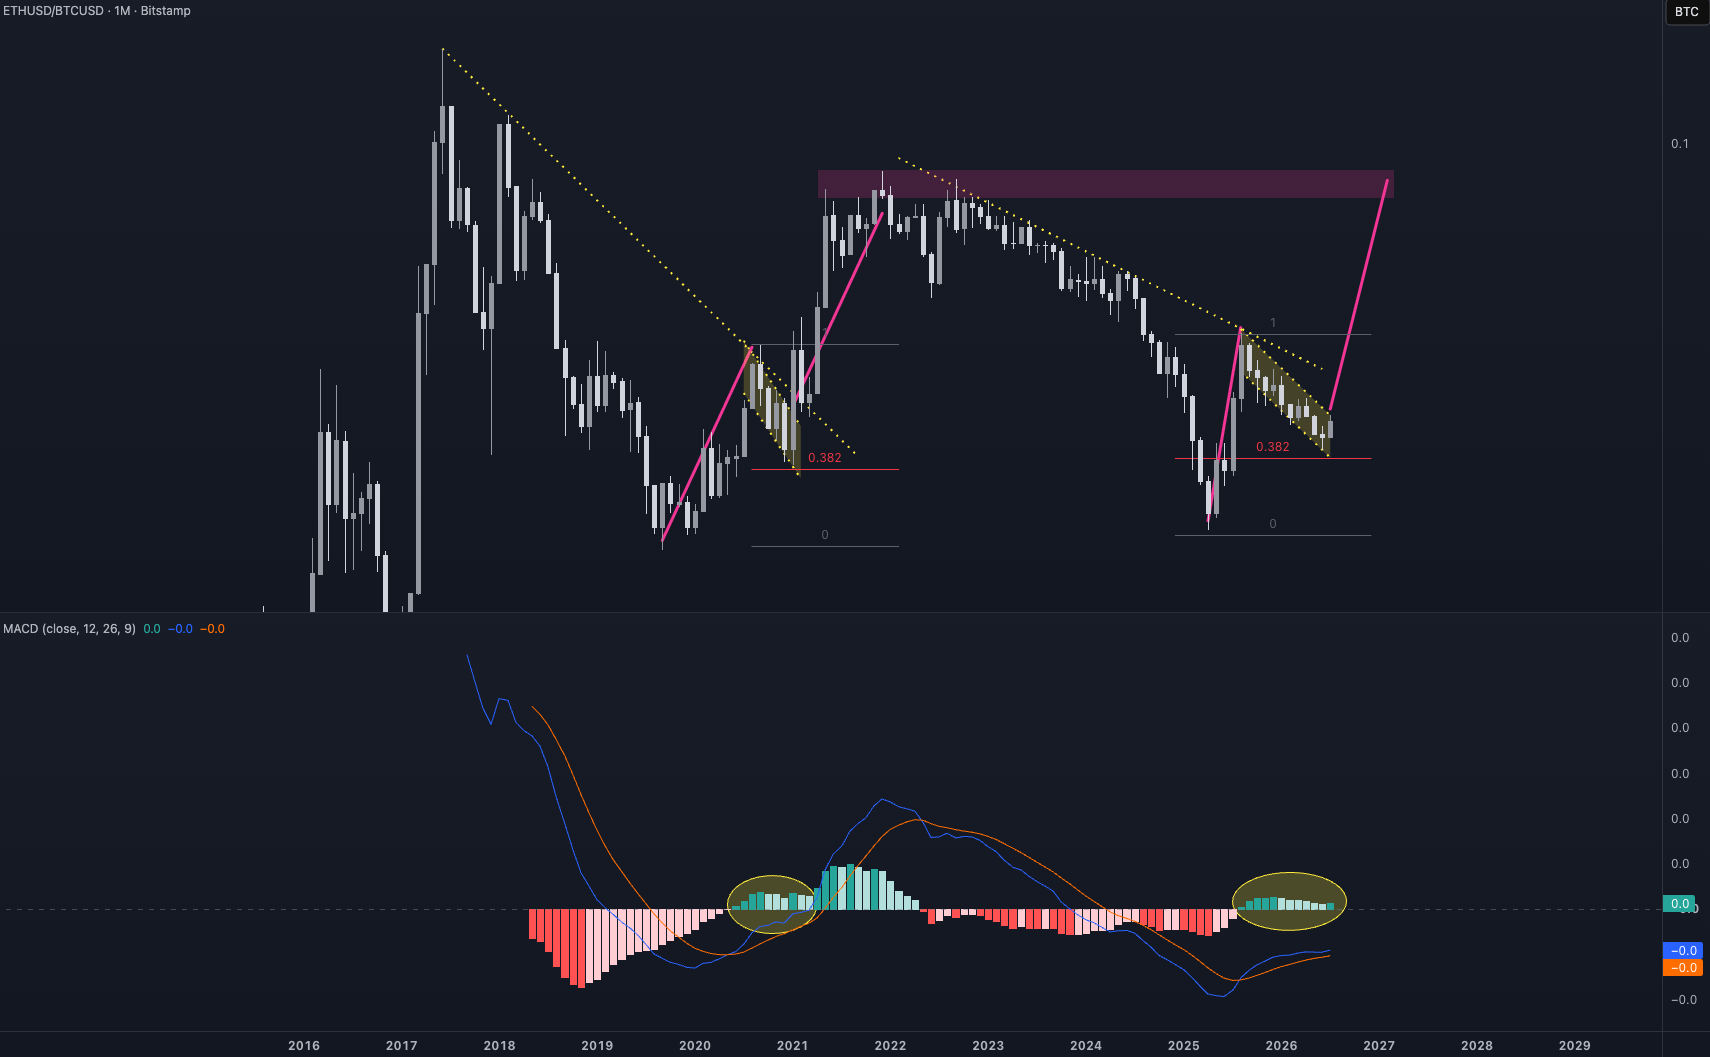
Read it carefully. The yellow diagonal downtrend lines defined the long decline. Beneath them the ratio carved out a flag, retraced down to the 0.382, and held it, and it is now pressing the upper boundary of that flag while the MACD in the lower panel rises and curls off the bottom, getting ready to send it positive. Now look left at the last cycle, because this is not a loose resemblance. The identical sequence printed in the second half of 2020, the same diagonals, the same flag, the same 0.382 hold, the same MACD curl, and the business cycle sat in the identical position beneath it while it happened. Two independent methods stamping the same date on our position is exactly the kind of agreement this newsletter is built to find. Last issue’s timing work pointed the rotation window toward September, and the flag is now pressing that timeline from below.
The trigger from here is unambiguous. A confirmed breakout of this flag confirms, for me, a huge leg higher in ETH/BTC, the leg that targets the purple resistance at the old highs near 0.08, and a rising ETH/BTC does not lift Ethereum alone. It is the market saying it is finally willing to move out of Bitcoin and down into risk again, and it pulls the whole curve behind it. The flag has not broken yet, and I am not front-running the trigger with the broad basket. But everything about this setup says the market is loading the same spring it loaded six years ago, which makes this the right moment to look underneath the majors at where the attention is already moving.
The Gem Score
The Methodology
I promised in Issue #96 that once the low was in hand I would take the token work sector by sector. Today I am delivering it, but not as a list of charts I happen to like. I have built a scoring system for it, the Gem Score, designed to answer one question in a repeatable way: where is real attention arriving before price has rerated? It debuts in this issue, it will be rerun and republished with every issue going forward with the score changes tracked, and over time I intend for it to live as a standing page that refreshes on the newsletter’s cadence. For now it prints here.
The funnel works like this. The full social-tracked universe, more than 5,000 assets, gets screened across eight sector lenses. Eligibility gates then remove everything that cannot honestly be called an investable gem, which means a minimum $25M market cap, a minimum $1M in daily volume, at least 90 days of trading history, and no pure meme spam. Eighteen candidates survived this issue’s screen. Each one was then scored across five weighted components.
Divergence, worth 30 points, measures attention building while price has not yet moved, which is the entire premise of a hidden gem.
Momentum, worth 25, measures the rate and acceleration of that attention against the coin’s own baseline.
Breadth, worth 20, counts independent voices, unique accounts rather than raw post counts, and punishes bot spam and single-whale engagement spikes.
Conviction, worth 15, reads the quality of sentiment, whether it is improving off its base and whether it holds through red days.
Tailwind, worth 10, scores alignment with the sector rotation framework you already know from these pages.
Guardrails cut across all of it: a coin that has already pumped takes a Divergence haircut, spam-heavy tape takes a Breadth penalty, and manipulated-looking engagement gets flagged outright.
Two things I want to be upfront about, because a scoring system is only as credible as what it discloses. First, every finalist was cross-verified on X itself, with independent mention counts and a manual check of the actual accounts driving each move, their age, their reach, and whether they are real participants or a paid chorus. Second, one name was excluded for data quality. Celestia’s social feed is contaminated by unrelated content that shares its name, its score would have been untrustworthy, and rather than publish a bad number I am publishing the exclusion. Seventeen names carry scores this issue. The bands are simple:
Below 40 is noise
40 to 54 is watchlist
55 to 69 is candidate
70 to 84 is a strong setup
85 to 94 is exceptional
95 and above is reserved for the rare case where every component peaks at once. I expect to hand out a 95 about once a cycle.
The top score this issue is a 72.8, and that calibration is deliberate. When this board eventually prints a 90, I want the number to mean something.
The Board
The Gem Score board is for paid subscribers.
Seventeen names carry scores this issue. Three cleared the noise line, and one printed the strongest early-attention signature of the debut. Paid members get the full ranked board, the name-by-name breakdowns behind every score, and the re-run each issue with changes tracked, so the system builds its record in public.
Closing
So here is the whole picture. The majors bottomed where and when the roadmap said they would, the recovery is pressing its first real resistance on both charts, and the paths through 2027 stand exactly as they were drawn in Issue #95, with $2800 to $3400 on Ethereum and $94K to $98K on Bitcoin still the September to October waypoints. One signal separates conviction from confirmation, the 3-day Supertrend flipping green on both majors, the same signal that confirmed the late-2022 bottom, and the flips are walking down toward price as I write. Beneath it all, the engine and the monthly ratio agree that this is a second-half-2020 position, with the flag pressing its boundary and the MACD curling underneath it, and the breakout of that flag, whenever it prints, is the green light for the broad rotation.
My posture has not changed since Issue #96. I am long the majors through the consolidations, I am patient, and I am not yet in the broad alt basket, because that trigger belongs to the ratio flag. The Gem Score board is how I will hunt the narrow opportunities in the meantime, three names this issue, one strong, one flagged, and one waiting for its retrace, and every score reruns next issue with the changes printed, so the system earns your trust, or loses it, in public. And one promise made concrete: the portfolio forecaster overhaul I have owed you arrives once the bottom confirmation is in, tied to the same Supertrend flips described above, so the rebuilt forecaster launches on a confirmed foundation rather than a hopeful one. Last issue ended with the words we are close. We are one flip closer now.