
TechDev Newsletter - Market Update Issue #86
What About a 2008-Style Crash?
A reasonable concern has emerged among subscribers: what if we’re heading into a 2008-style Great Recession? Bitcoin has never experienced one. Would my business cycle analysis break if it finally did?
It’s a fair question. The frameworks I’ve built over the past several years are grounded in data from Bitcoin’s existence - roughly 16 years. A true economic collapse of the magnitude we saw in 2008 would be uncharted territory for crypto.
But here’s what the macro cycle indicators actually show: we’re currently at the same bottoming levels as after the Great Recession, not before it. The very indicators that would warn of an impending collapse are instead positioned at the levels that have historically marked the end of major economic contractions - including the deepest one in modern history.
Today I’ll walk through this evidence systematically. We’ll examine the business cycle positioning, the RSI bullish divergence that continues to build, and a leading indicator from copper miners that’s already signaling the reversal. I’ll also introduce a unique bottom indicator using the Bitcoin/Silver ratio that has fired at the exact bottom of every prior bear market - and just fired again.
Finally, I’ll address the short-term picture. While the macro setup points decisively higher, I see two possible paths from here - one where the correction has already ended, and one where we see a final leg down into the 60K range before the larger advance begins. I’ll show you exactly what to watch to determine which scenario is unfolding.
Given the urgency of this short-term monitoring, the altcoin structure analysis I mentioned at the end of last issue will be covered next time.
Today’s Topics
The 2008 Question
Leading Indicators
A Unique Bottom Signal
Short-Term Scenarios
Key Levels to Watch
The 2008 Question
Business Cycle Positioning
Let’s start with the most important chart for addressing the recession concern directly.
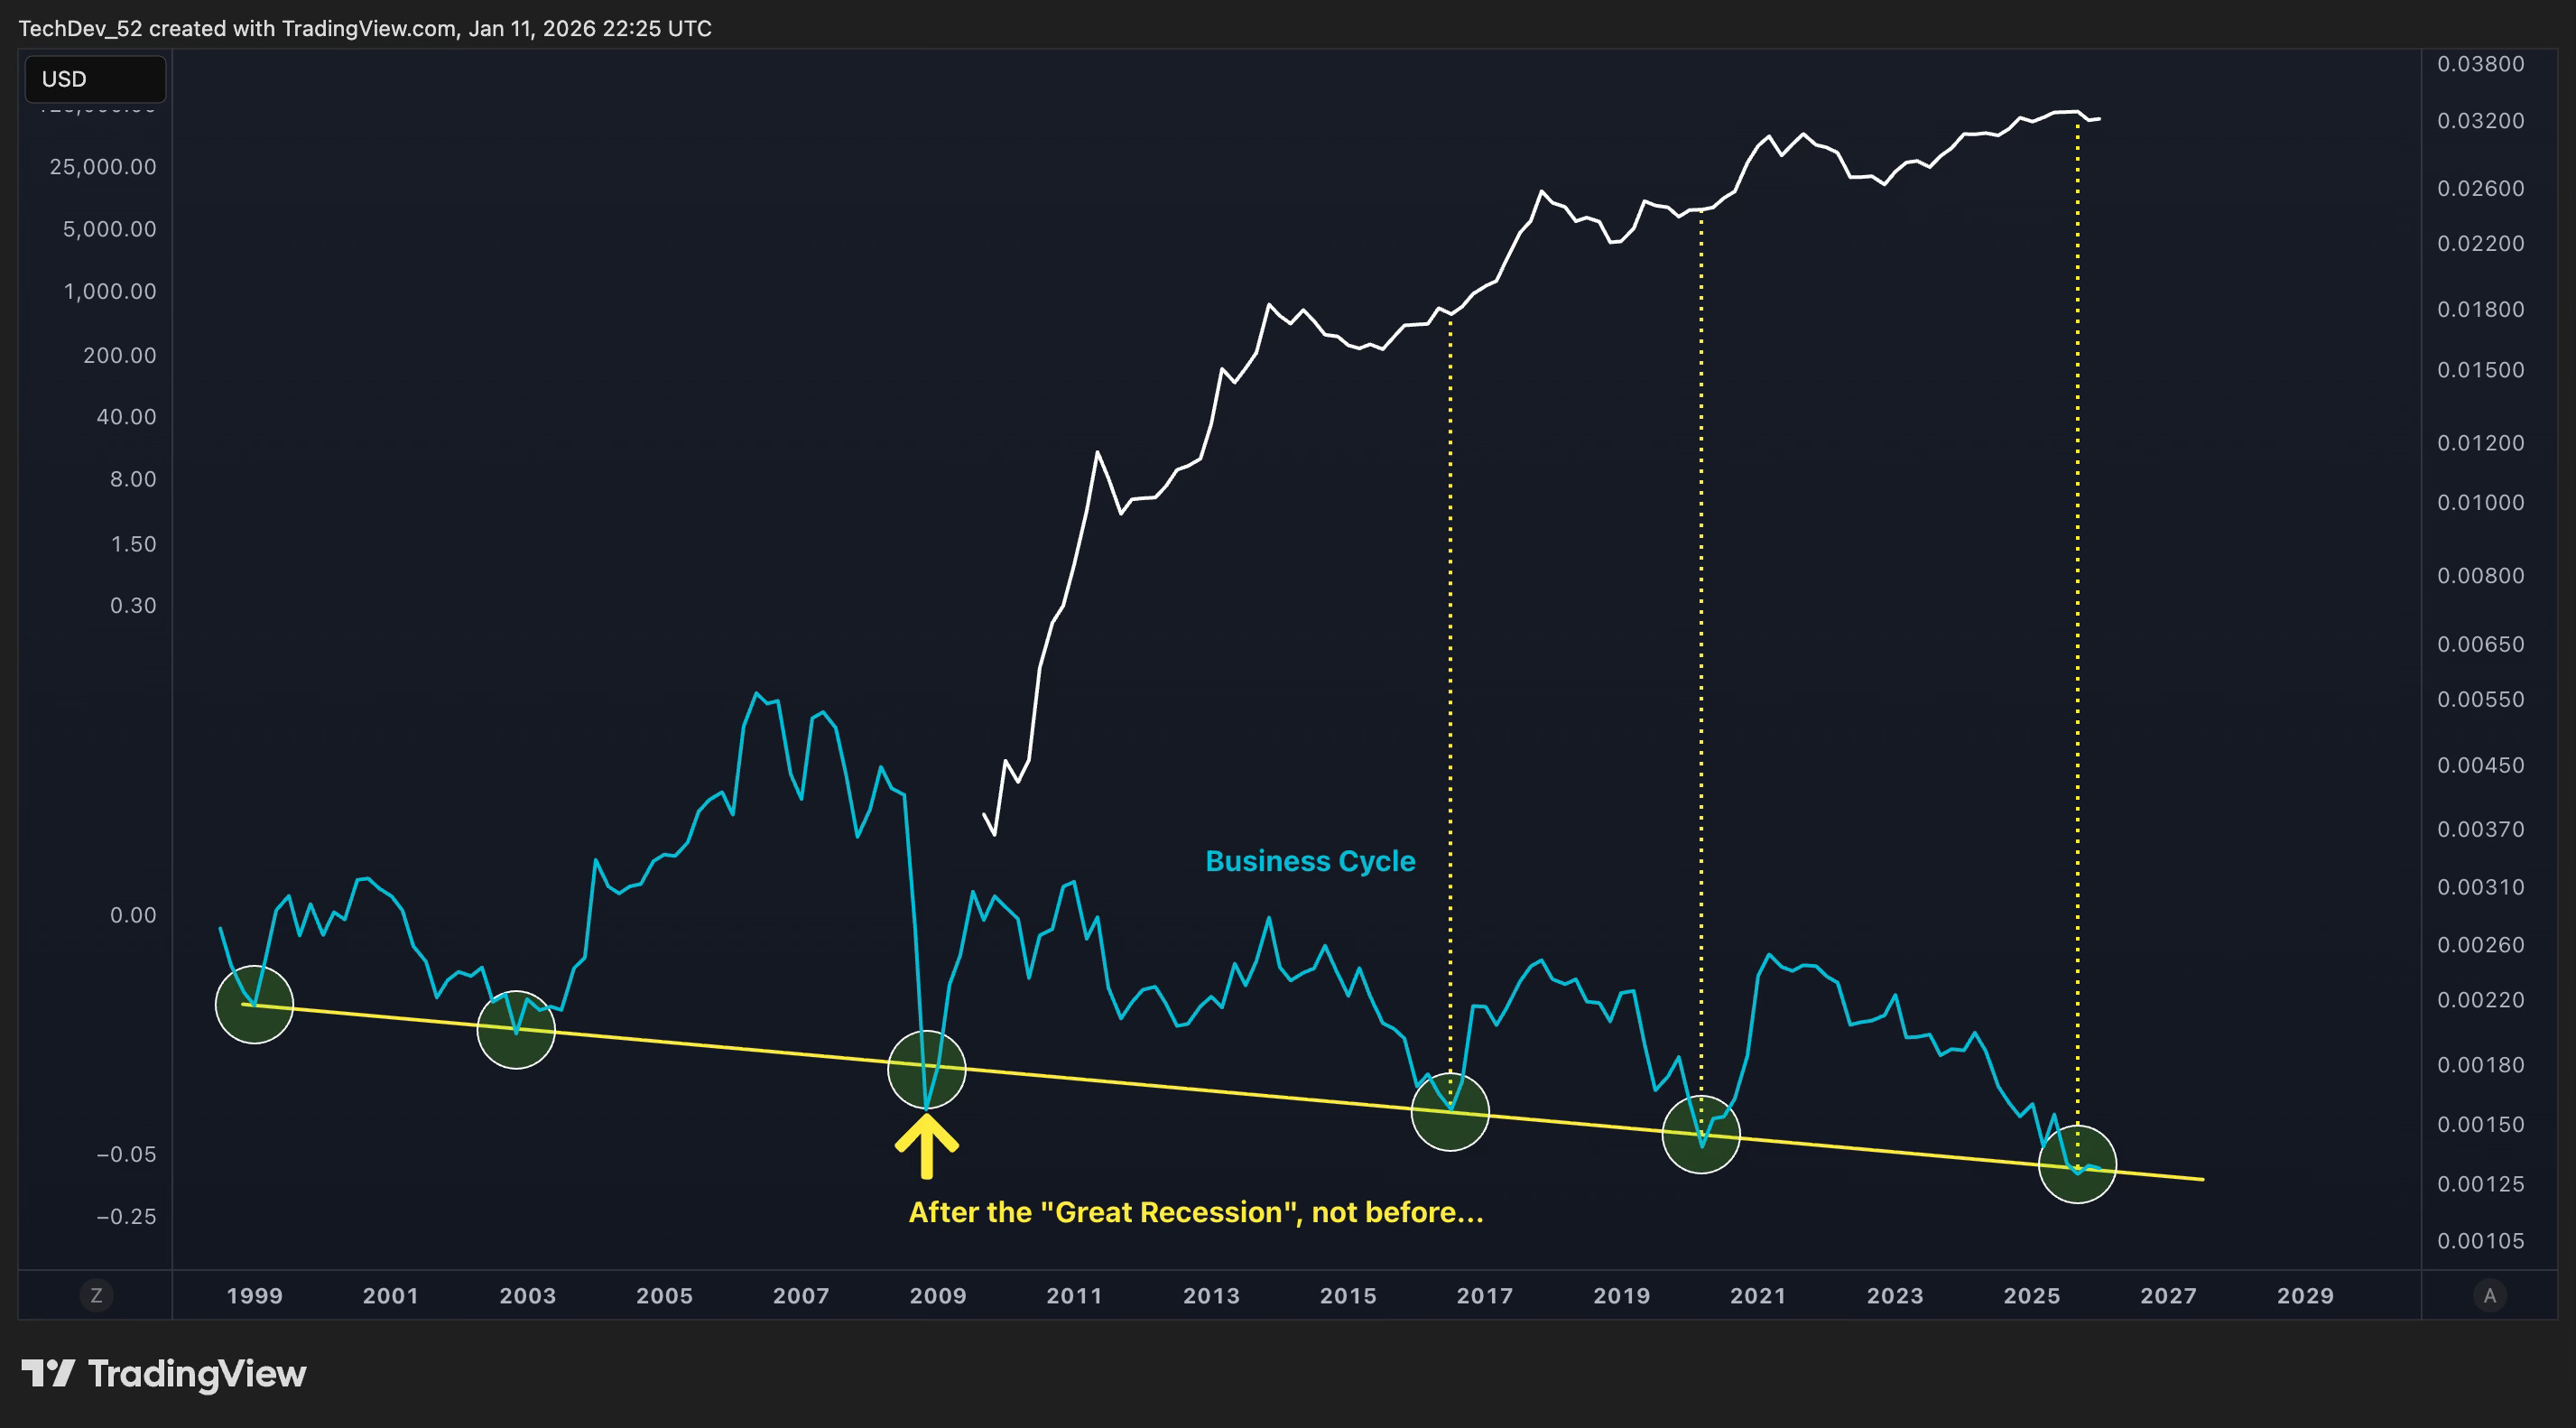
This is the Copper/Gold ratio on the 2-month timeframe, going back to 1999. The yellow line marks the level that has consistently identified the deepest business cycle reversals over the past 25 years. Look at where these reversals occurred:
Late 1990s/early 2000s
2003
2008-2009 (end of the Great Recession)
2015-2016
2020
Now
The critical point here is the 2008-2009 touch. That wasn’t before the Great Recession - it was after. The business cycle indicator reached this bottoming level as the recession was ending, not as it was beginning. The same level that marked the conclusion of the worst economic contraction in modern history is where we sit today.
This isn’t a signal that warns of impending collapse. It’s a signal that has historically marked the point where economic contraction transitions to expansion. Every touch of this level has been followed by a significant advance in risk assets.
Stochastic RSI Confirmation
Adding the Stochastic RSI to this framework provides additional confirmation of where we stand.
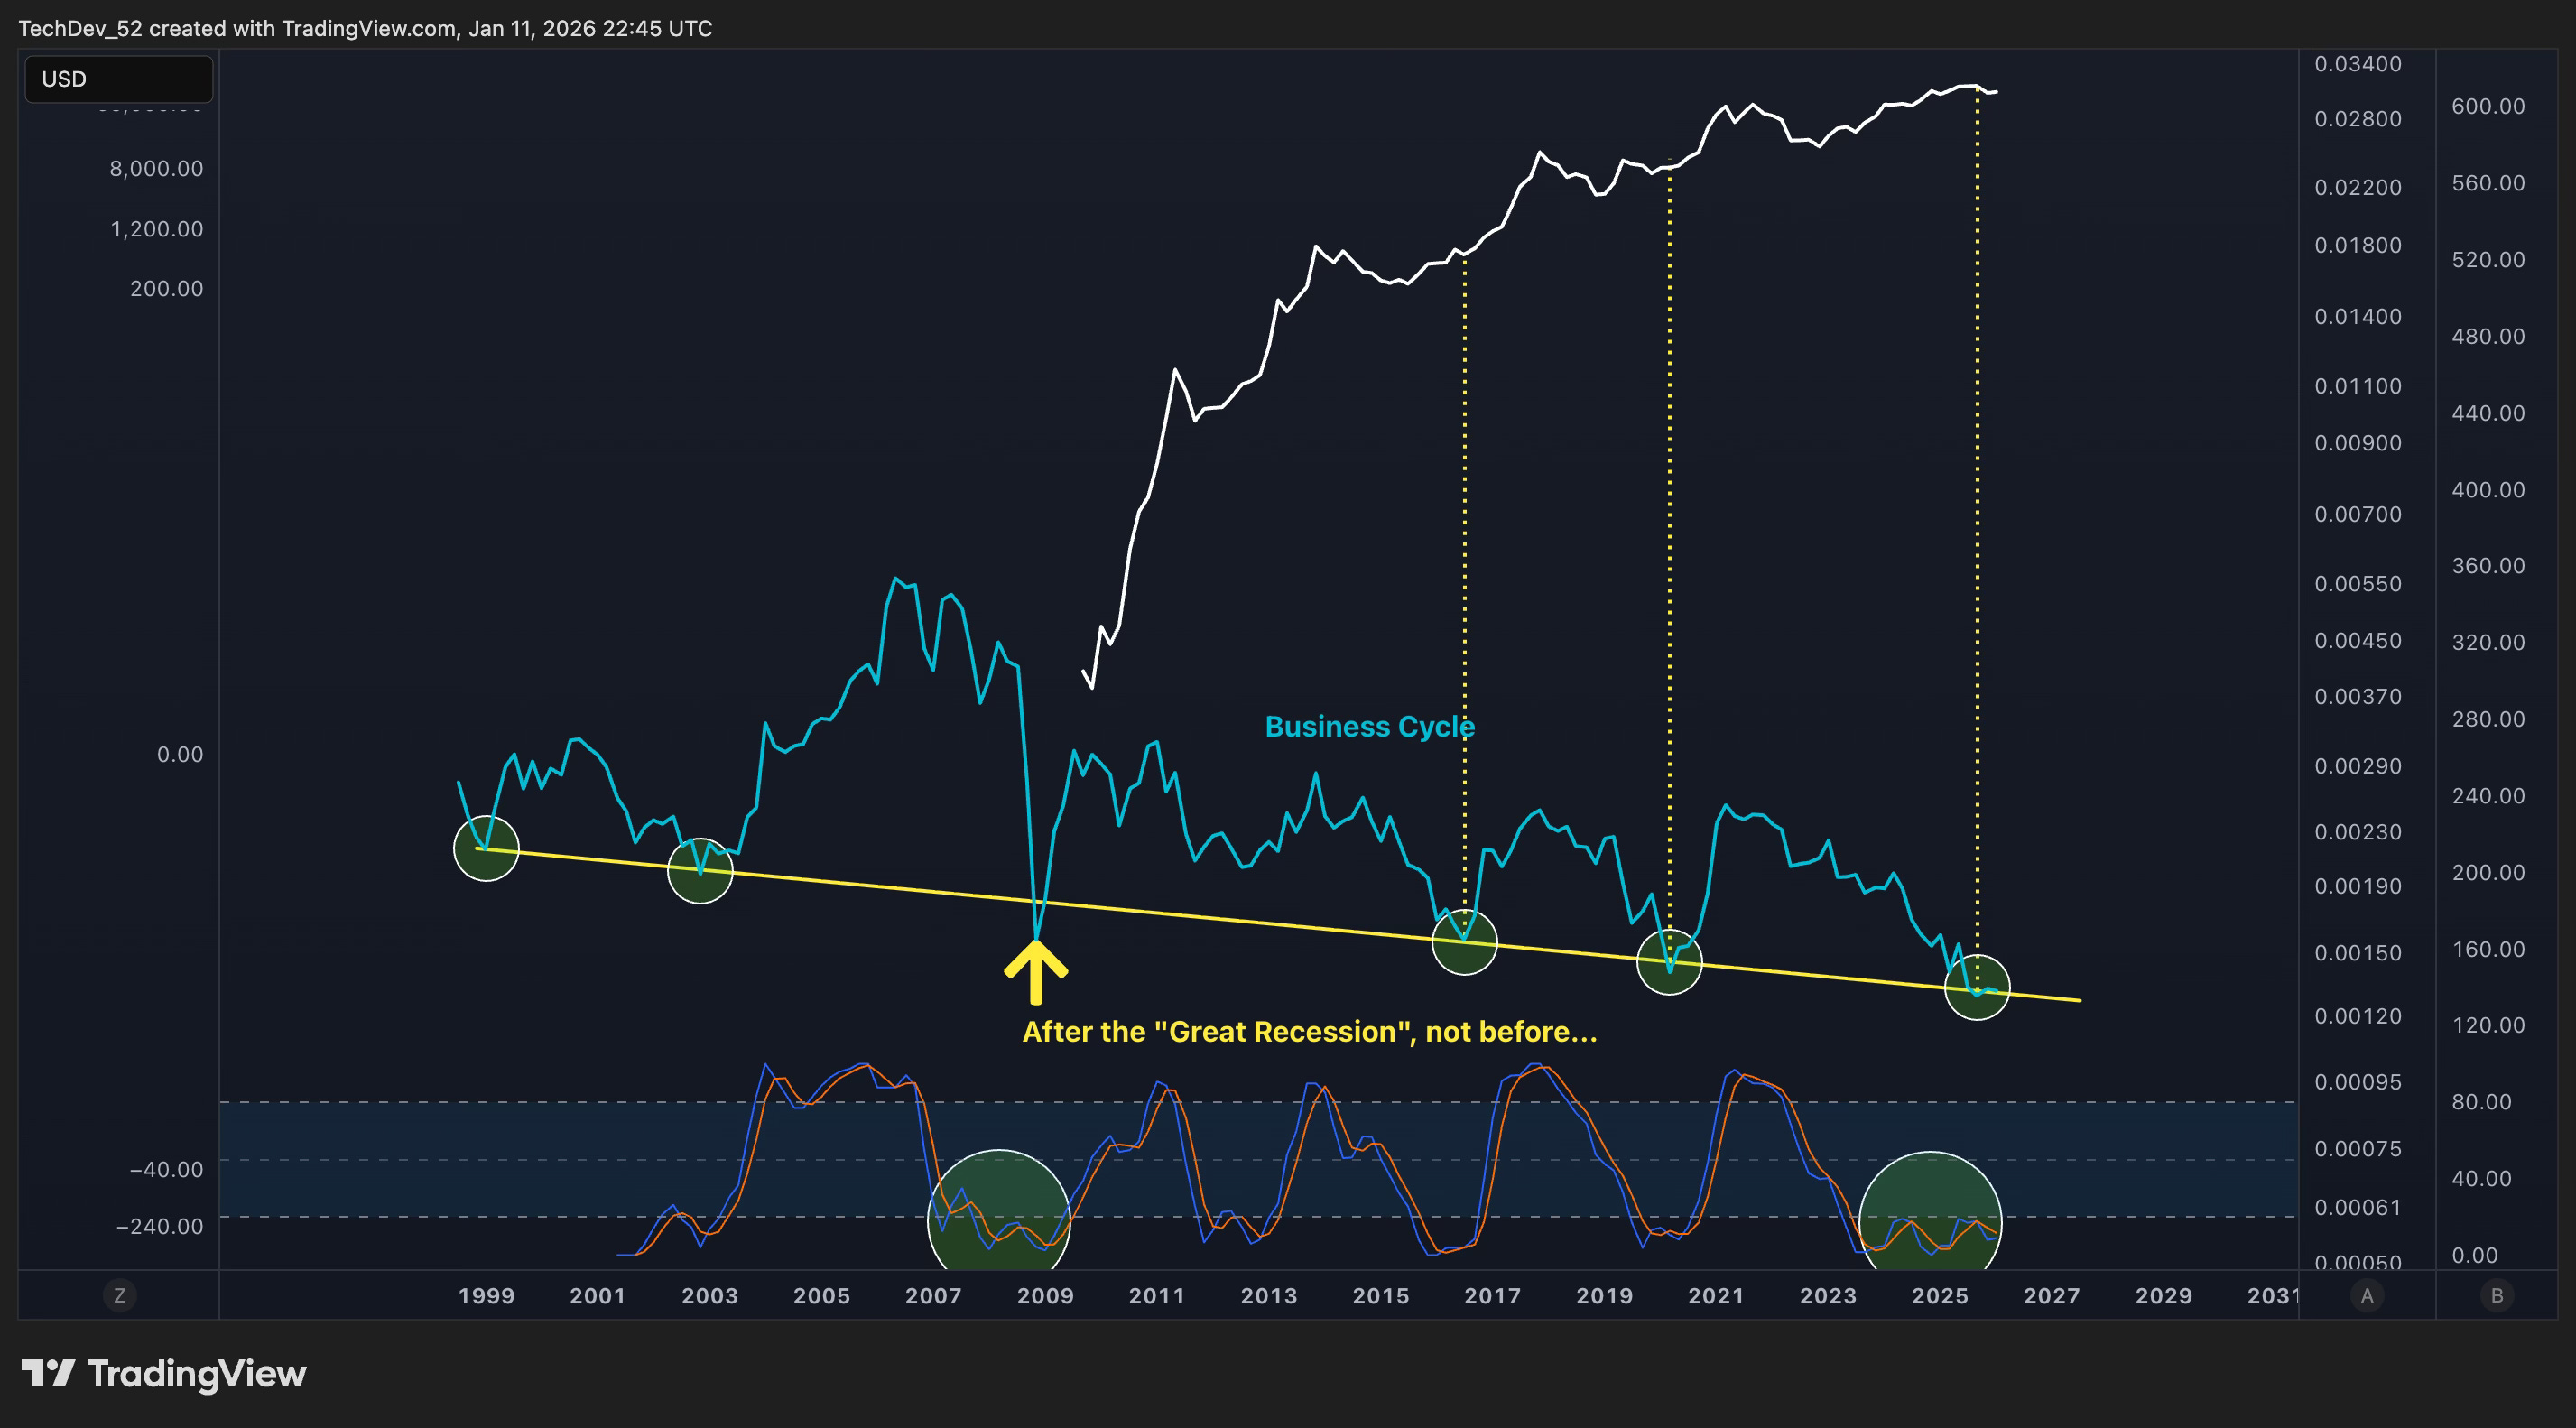
The green circles at the bottom of the chart highlight the Stochastic RSI bottoming zones. Notice the pattern: these momentum troughs have aligned with the same business cycle bottoming levels we just examined.
What’s particularly notable is the similarity between the current Stochastic RSI signature and what we saw at the end of the Great Recession. Both periods show the indicator reaching deeply oversold territory and beginning to curl upward from extremes. This is the momentum reversal signature that precedes major business cycle turns.
We’re not seeing the kind of momentum profile that precedes economic collapse. We’re seeing the profile that follows it.
RSI Bullish Divergence
Now let’s examine what I consider one of the most compelling signals for the upcoming reversal - the bullish divergence building in the Copper/Gold ratio.
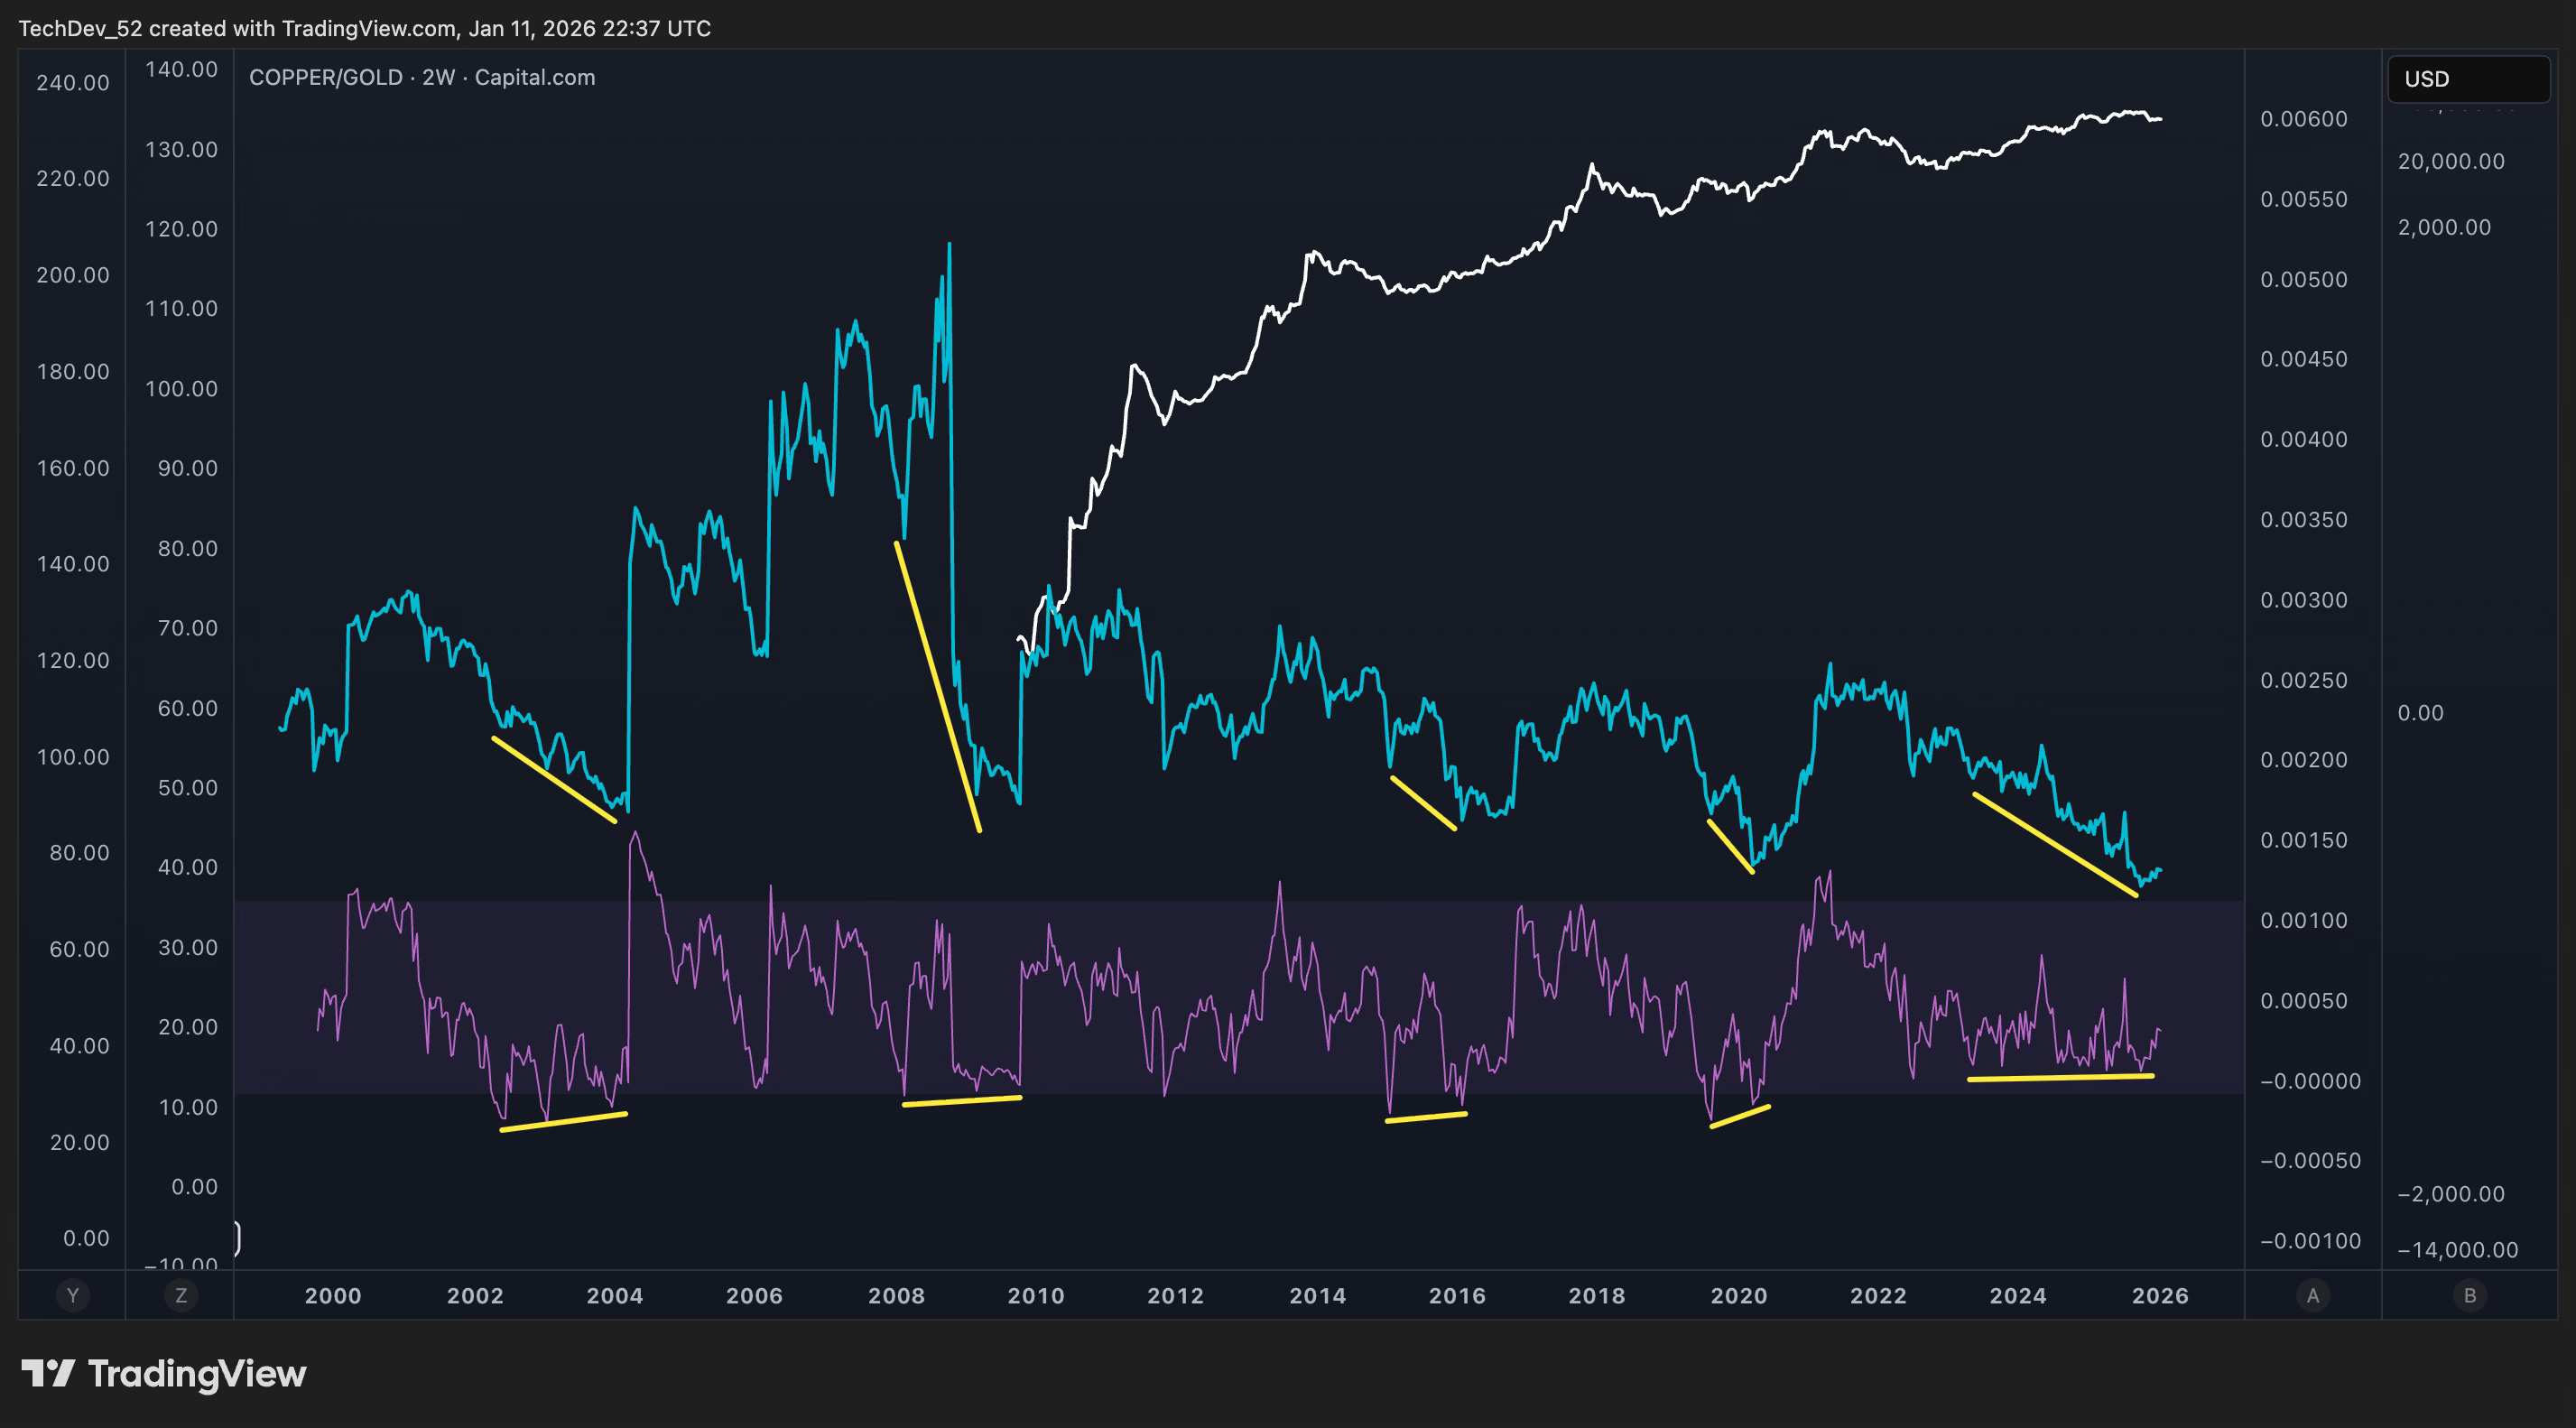
The yellow lines on both the price and RSI panels tell the story. As the Copper/Gold ratio has made lower lows, the RSI has made higher lows. This is textbook bullish divergence - a momentum reversal signal that warns of an impending trend change.
Study the historical instances marked on this chart. Every single bullish divergence period in the Copper/Gold ratio - including at the end of the Great Recession - was followed by a major reversal in the business cycle and consequently in risk assets.
But here’s what makes the current setup particularly compelling: the duration. The only time we’ve seen anything close to this prolonged a buildup of bullish divergence was around 2003. What followed was a monstrous multi-year advance.
The extended nature of this divergence isn’t a sign of weakness - it’s a sign of the magnitude of the reversal being loaded into the system. The longer the compression, the more powerful the release.
Leading Indicators
Copper Miners as a Leading Signal
If the Copper/Gold ratio is our primary business cycle indicator, copper miners serve as its leading signal. The logic is straightforward: mining equities discount future copper prices, meaning they tend to move before the underlying commodity.
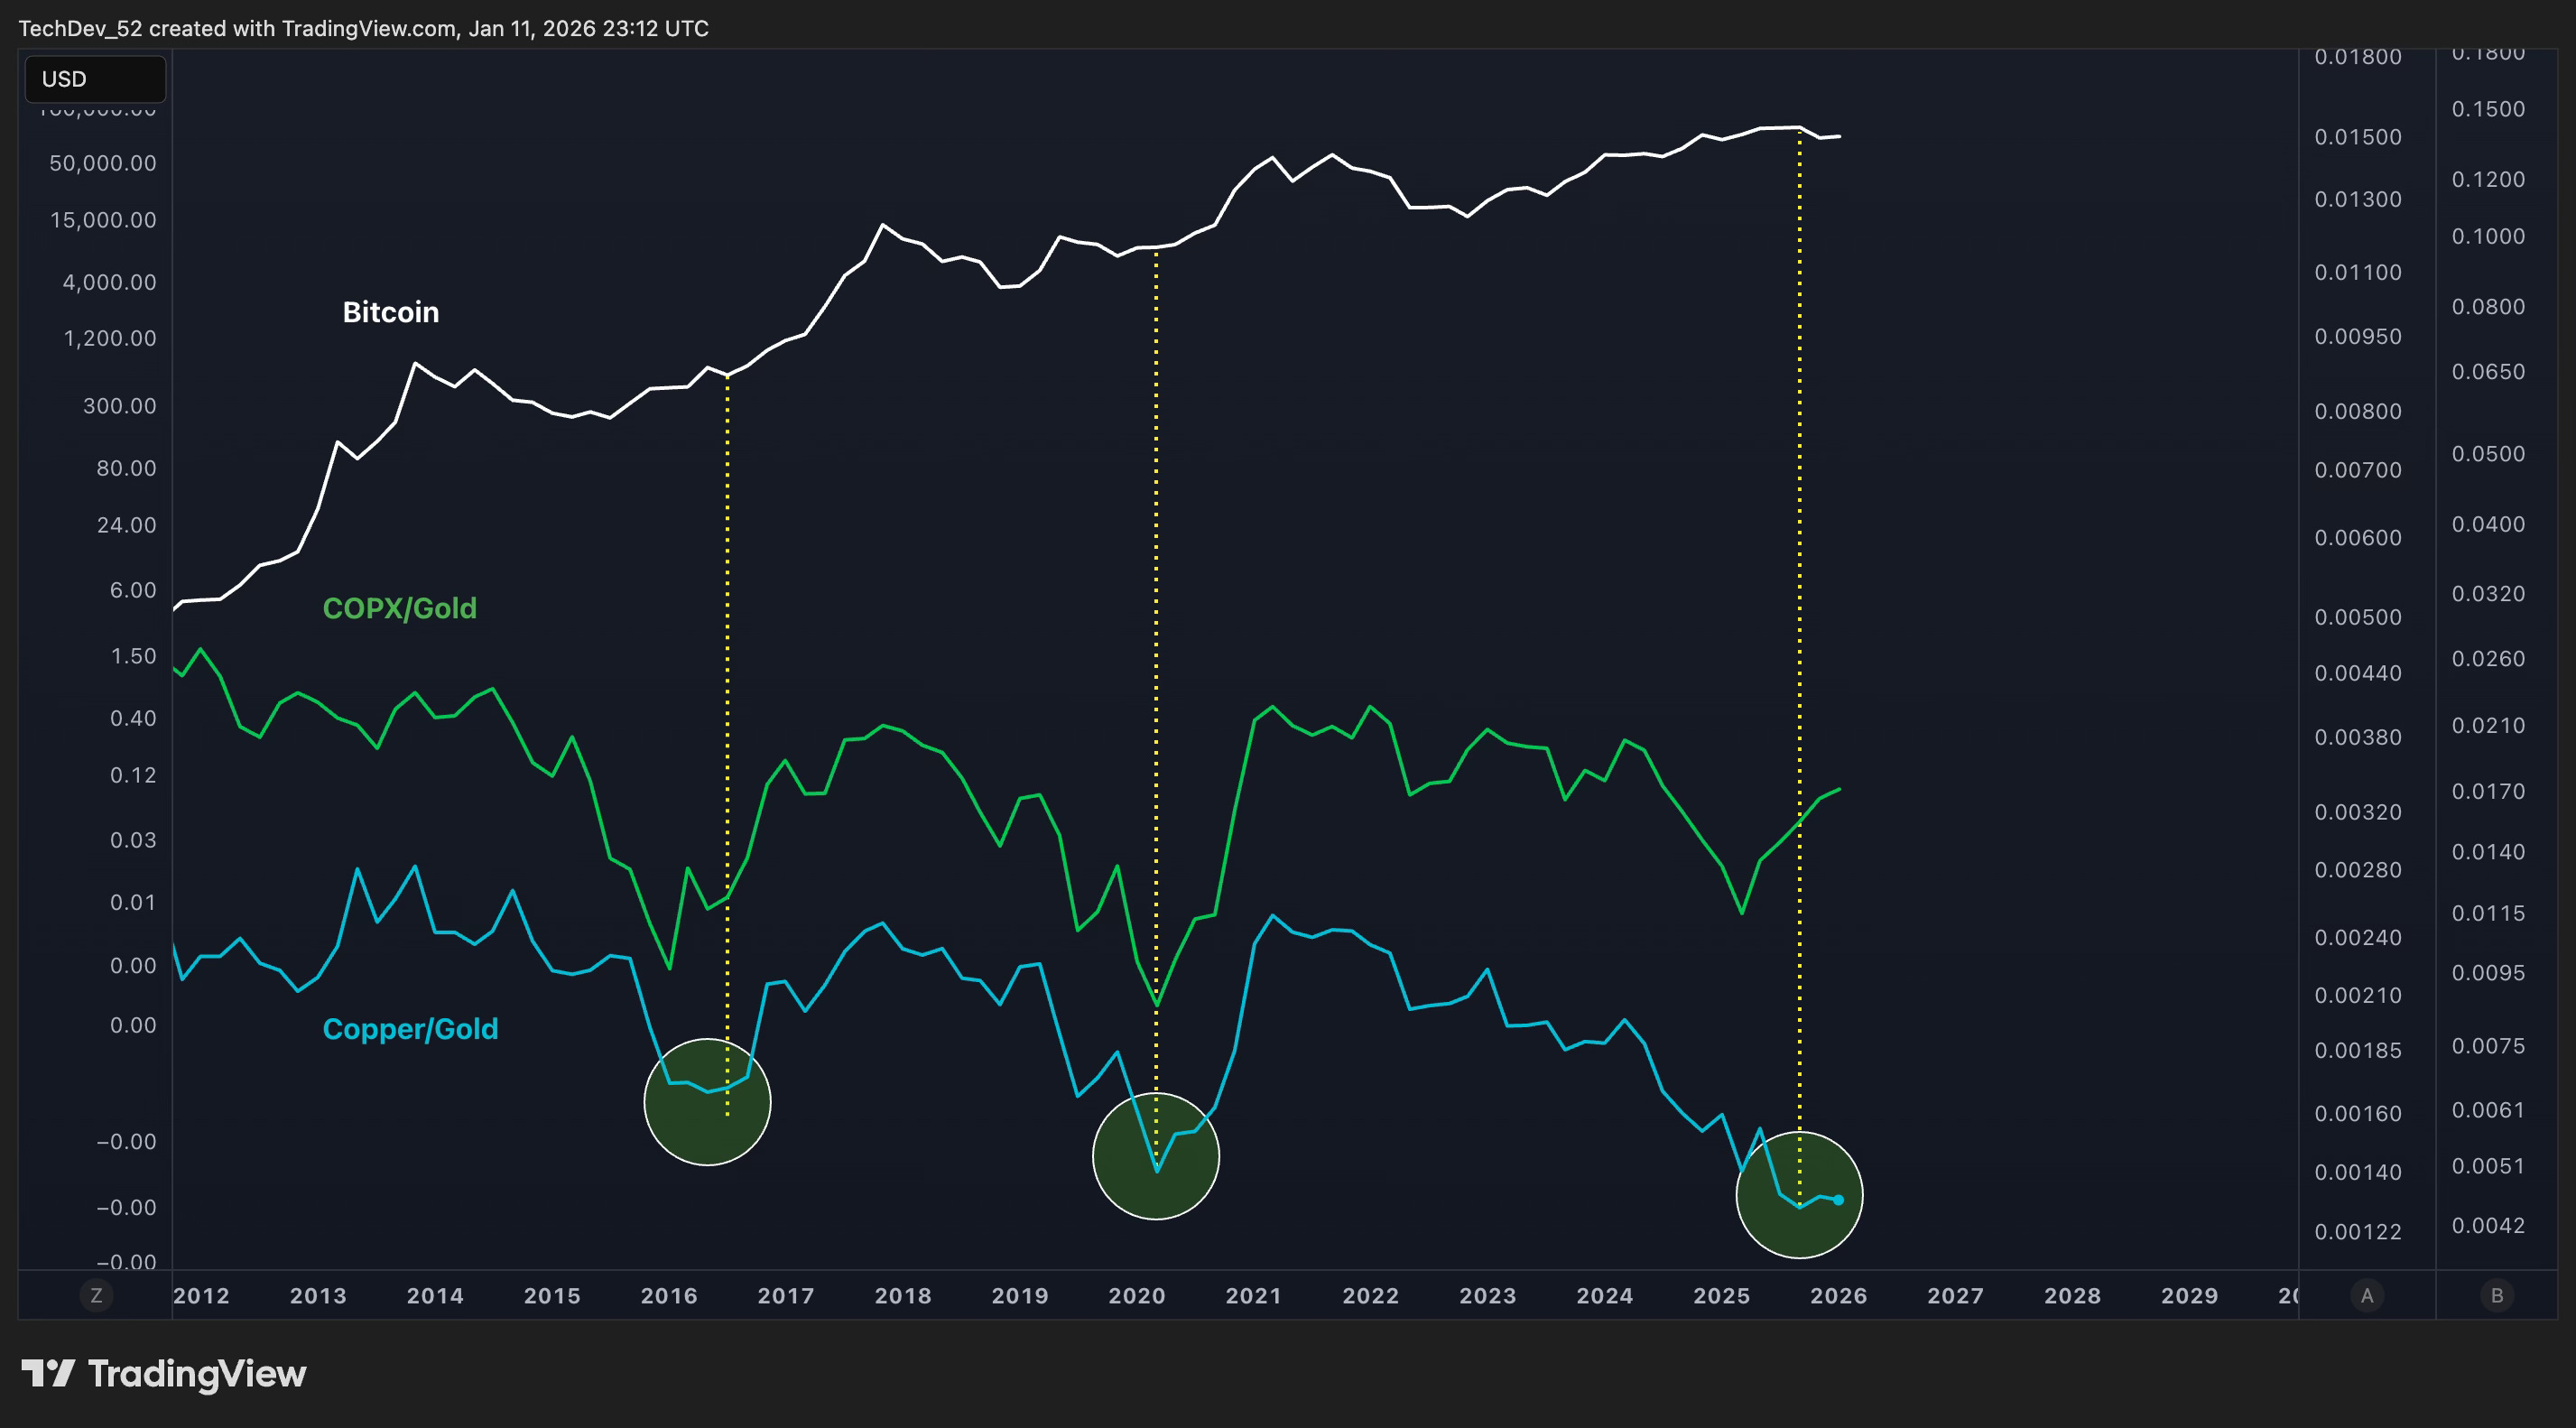
This chart overlays COPX/Gold (copper miners relative to gold) with the Copper/Gold ratio itself, alongside Bitcoin for context. The green circles mark the key inflection points across cycles.
The pattern is consistent: COPX/Gold reverses before Copper/Gold does. It serves as an early warning system for business cycle turns.
Look at what’s happening now. COPX/Gold has already violently reversed from its lows. The leading indicator has turned. Based on the historical relationship, this implies the same reversal is coming for the actual Copper/Gold ratio - and with it, the business cycle inflection that has preceded every major Bitcoin advance.
COPX/Gold MACD Cross
To add precision to this leading signal, let’s examine the 6-week MACD of COPX/Gold.
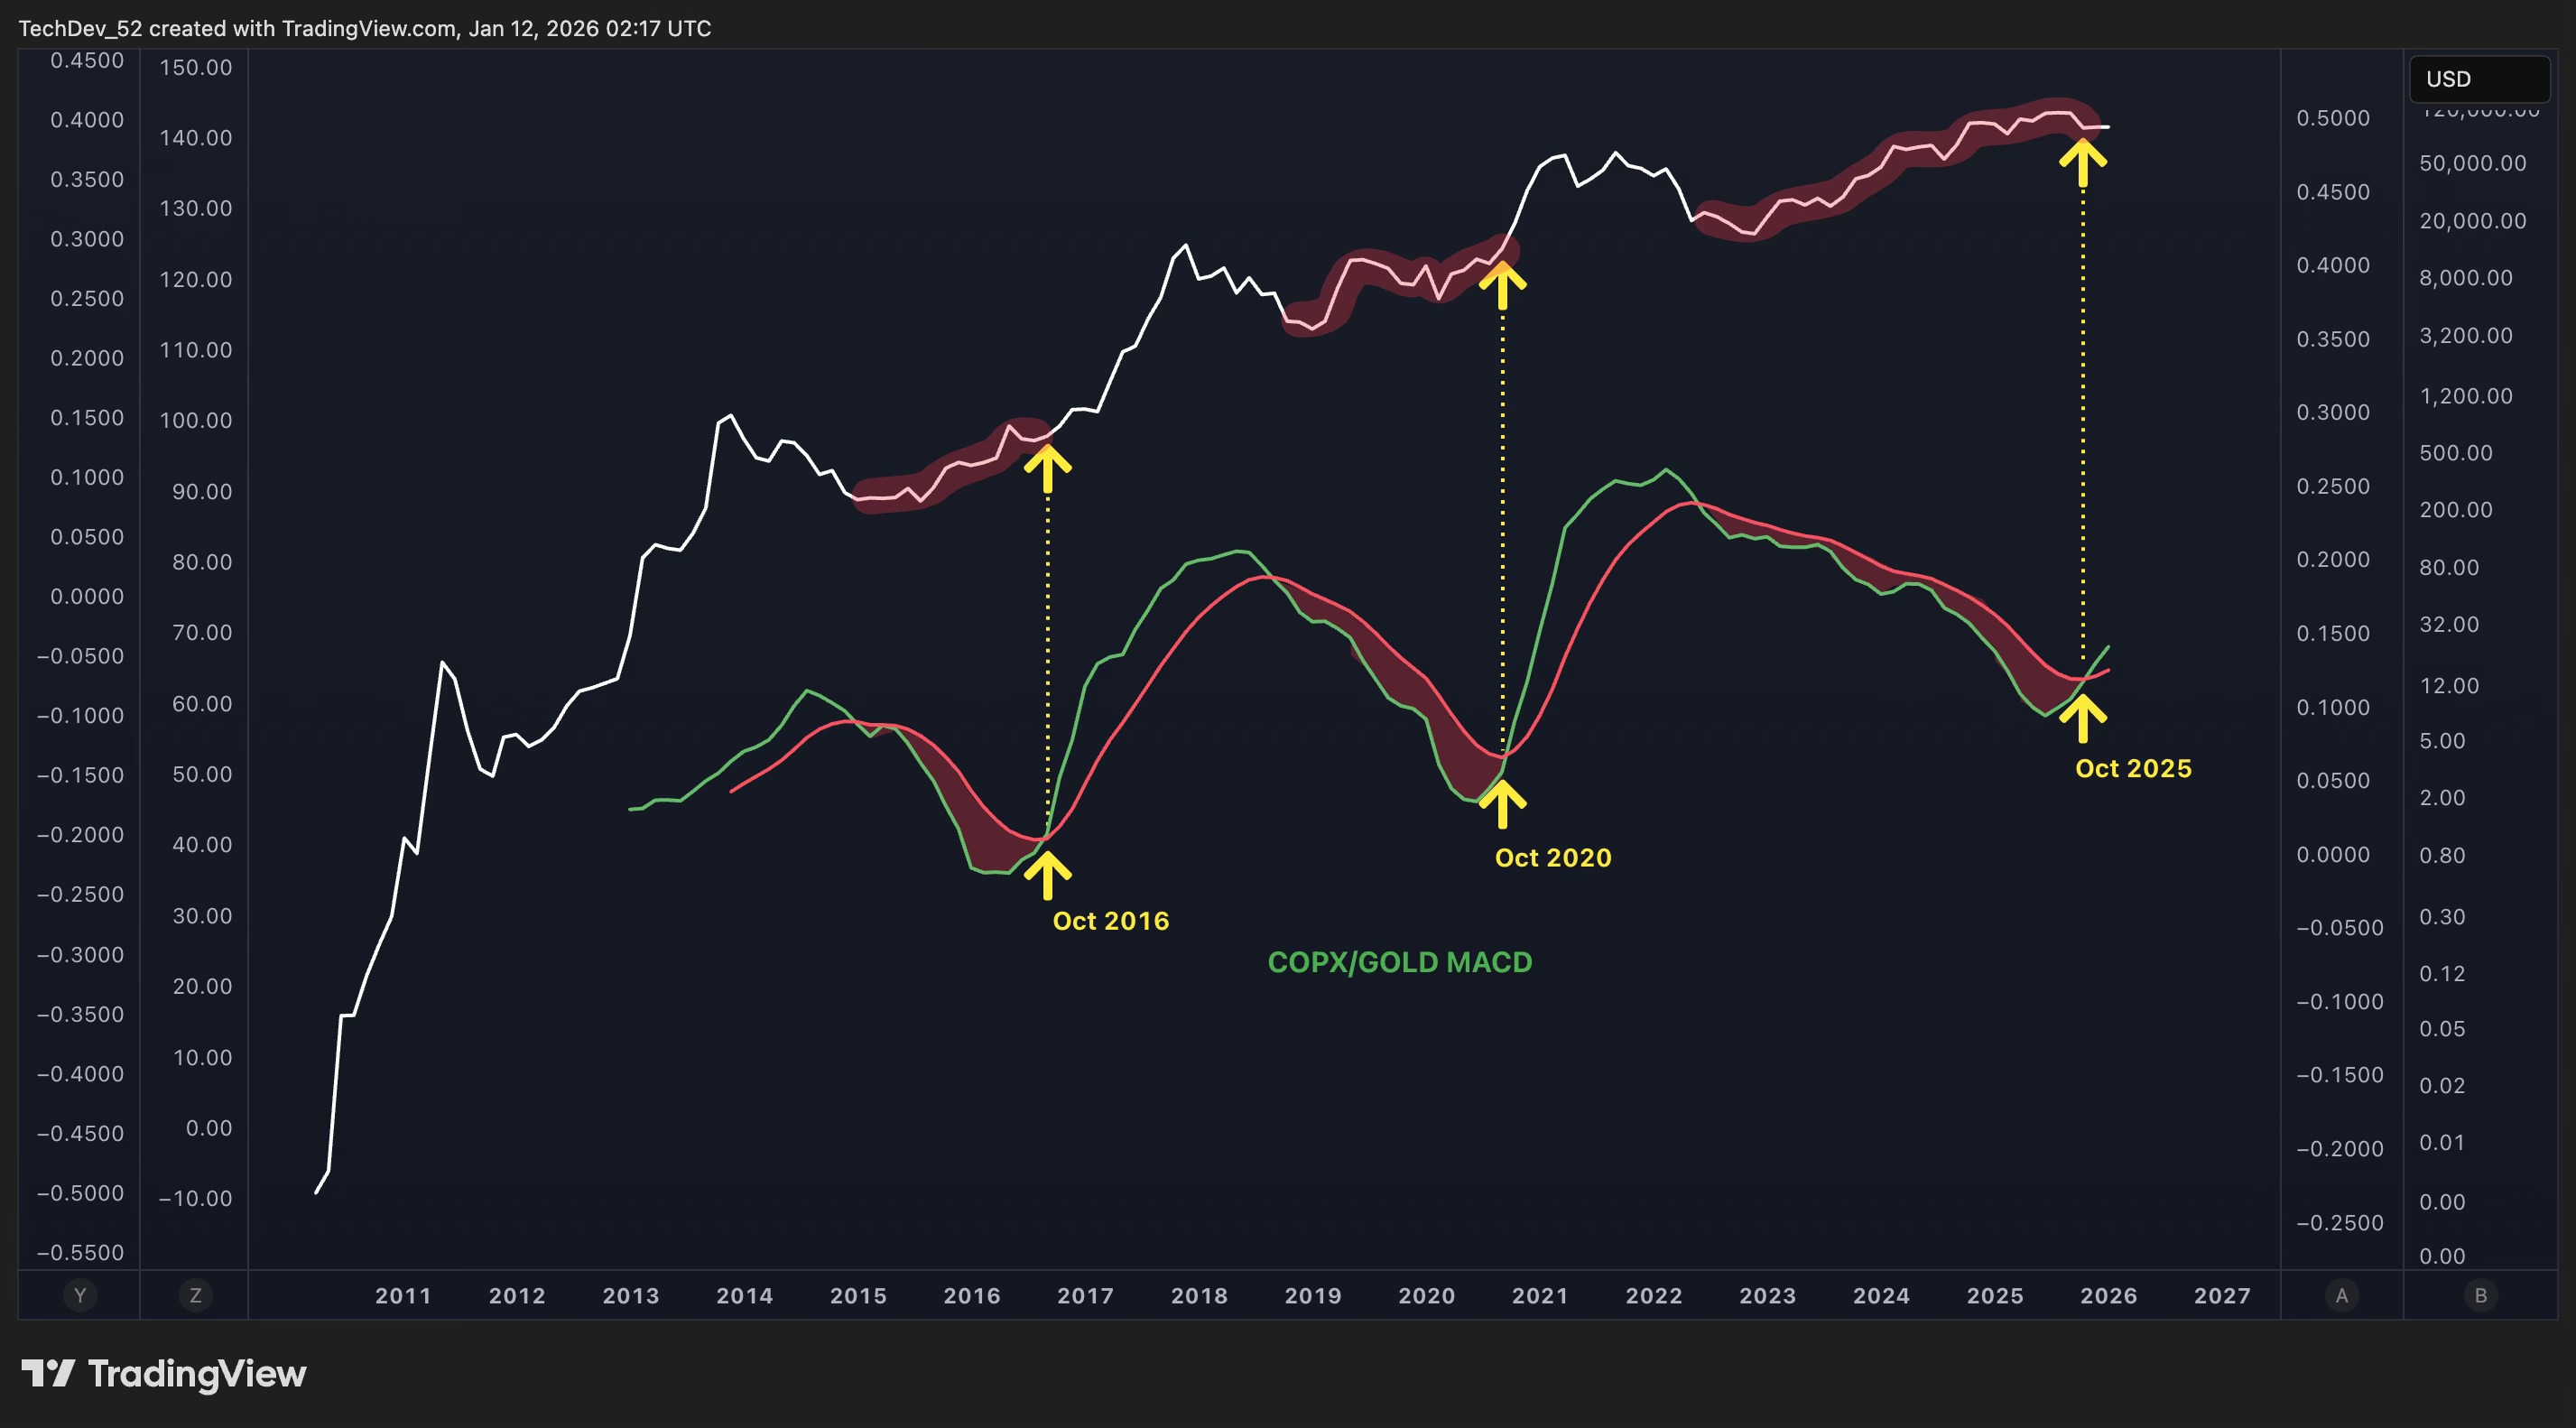
The yellow arrows mark the key moments: October 2016, October 2020, and now October 2025. In each prior instance, the COPX/Gold MACD cross preceded a significant advance in Bitcoin.
The signal has just fired again. The leading MACD cross that preceded the 2017 and 2021 runs is now in place for the current cycle.
This doesn’t guarantee timing - the lag between the COPX/Gold signal and the actual Copper/Gold reversal can vary. But the directional implication is clear: the leading indicator is telling us the business cycle turn is approaching.
A Unique Bottom Signal
Bitcoin/Silver Ratio
I want to introduce a signal I haven’t discussed publicly in some time - one that has an uncanny track record of identifying bear market bottoms.
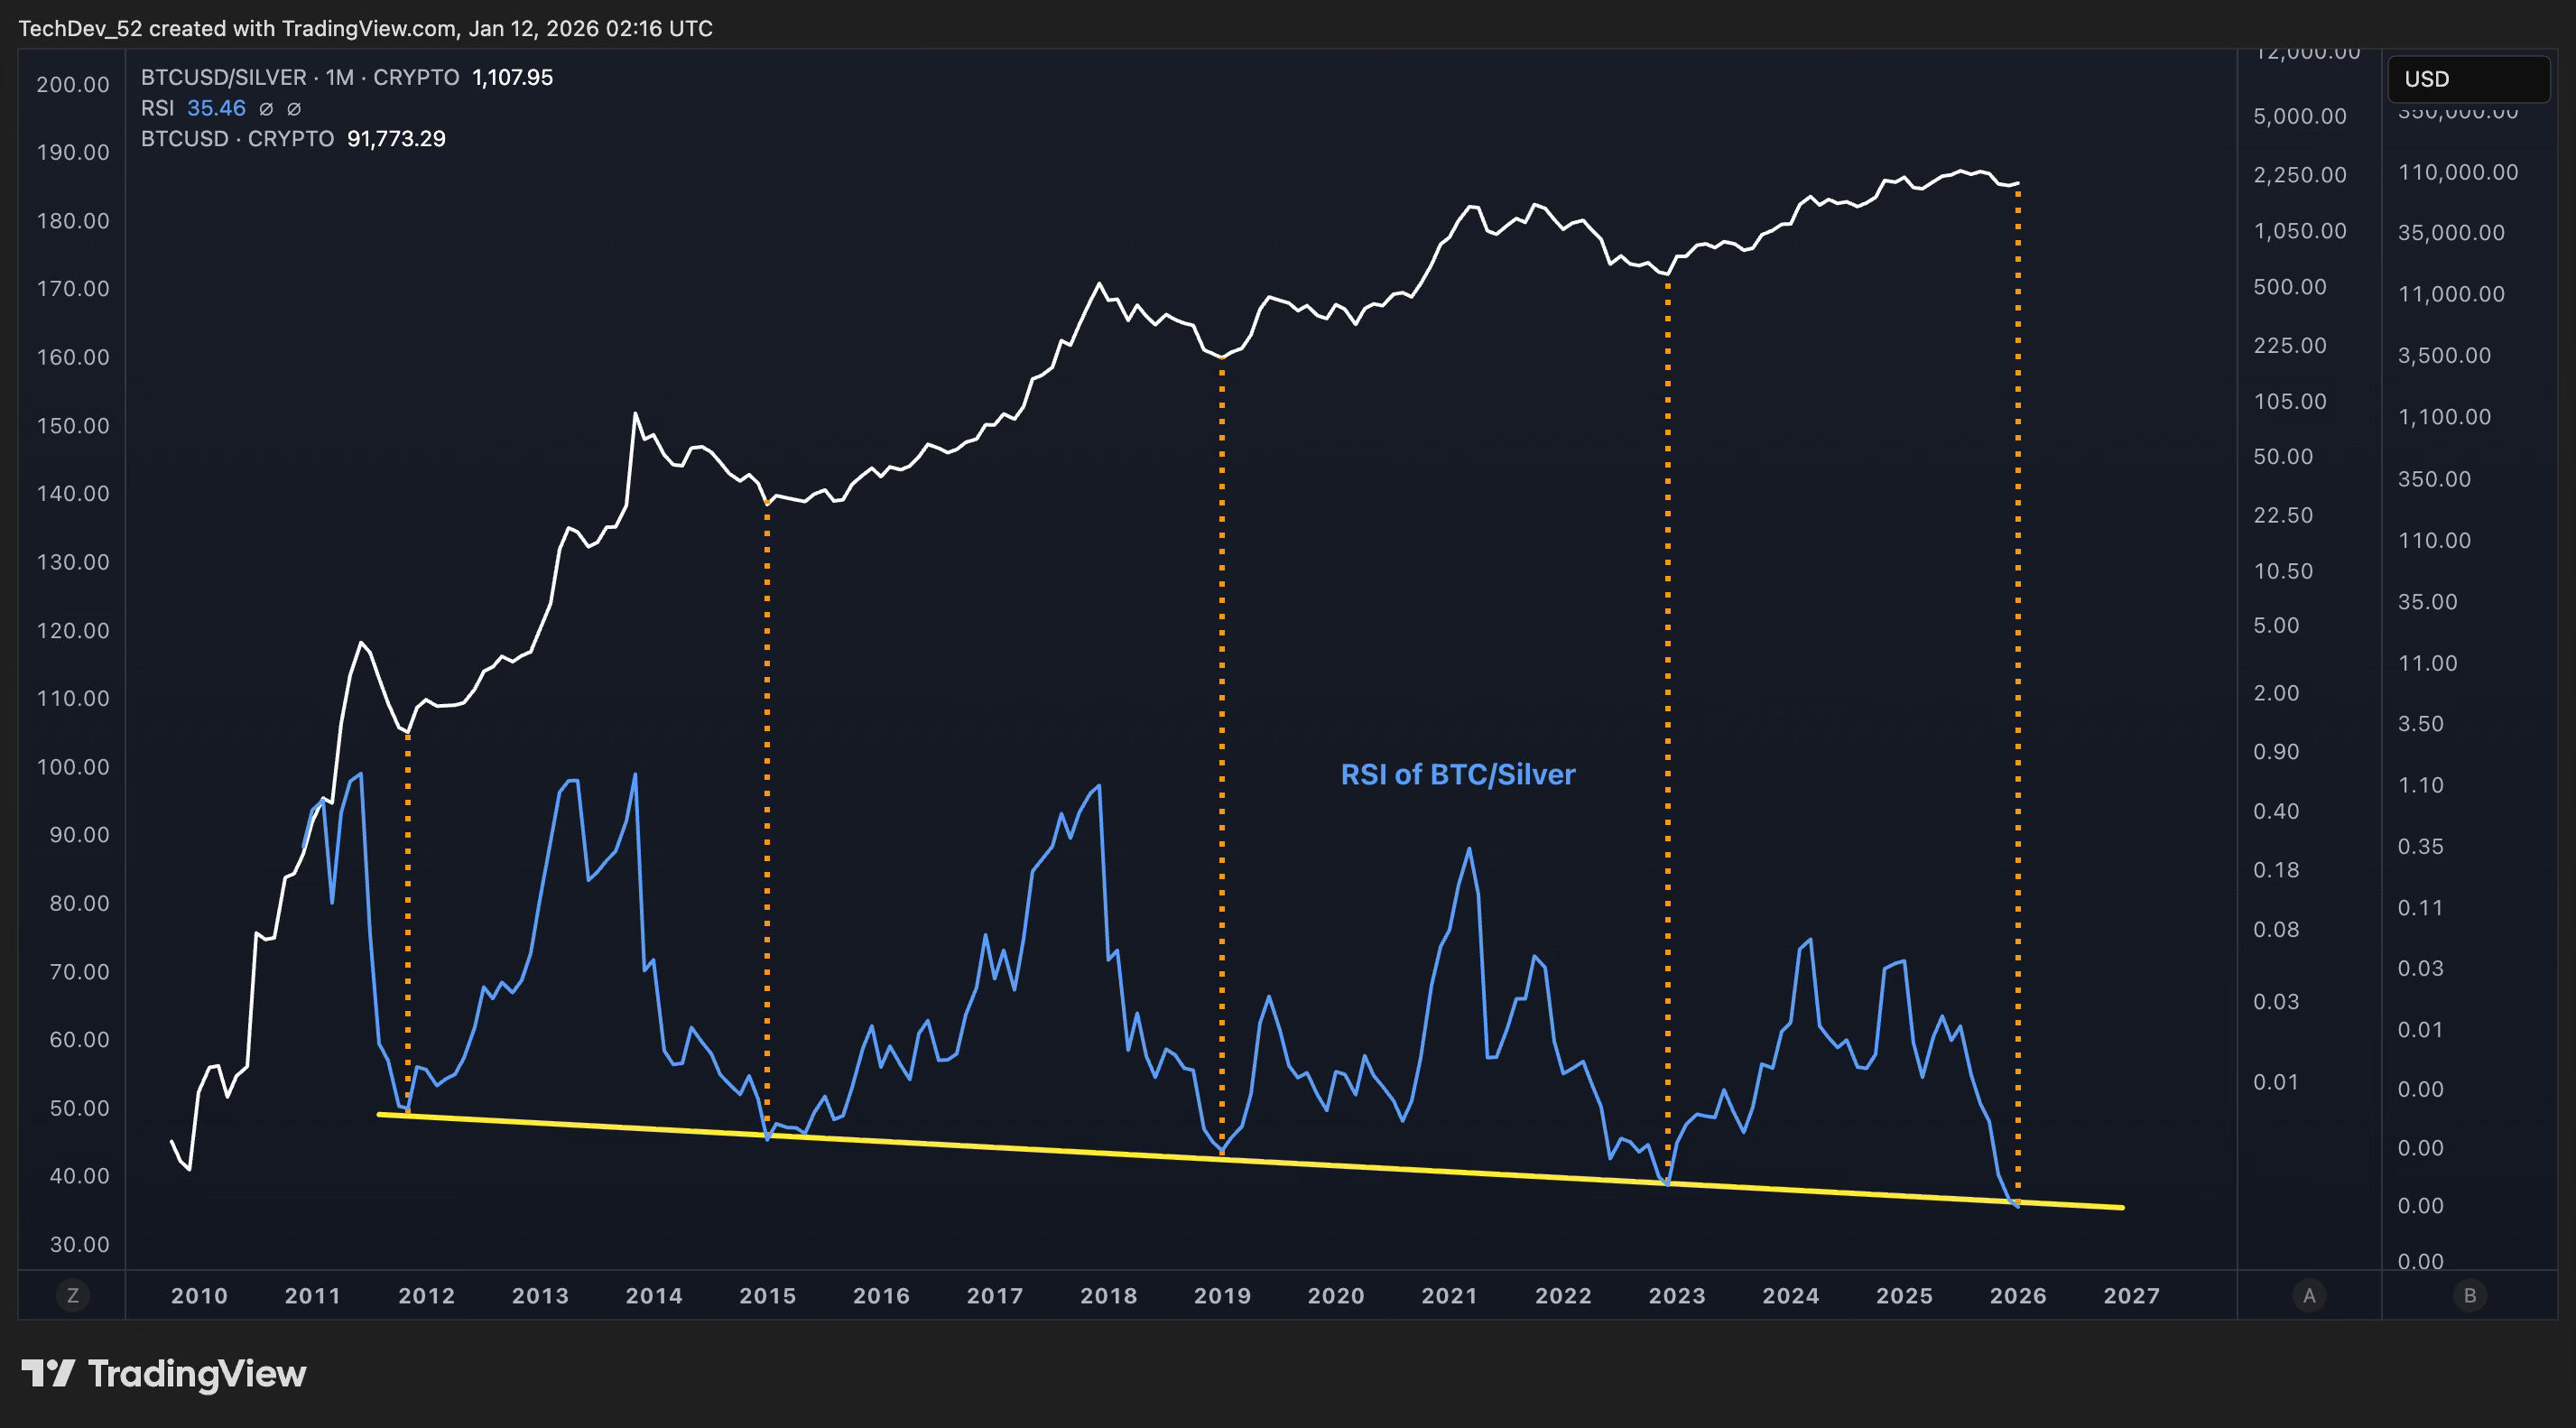
This is the 1-month RSI of the Bitcoin/Silver ratio. The yellow line marks the level that has consistently identified the exact bottoms of every prior bear market in Bitcoin’s history.
2011 bottom: RSI touched the line
2015 bottom: RSI touched the line
2018-2019 bottom: RSI touched the line
2022 bottom: RSI touched the line
Now: RSI sitting right on that same line
The consistency is remarkable. This isn’t a level that gets touched frequently - it specifically marks the deepest points of market pessimism, where Bitcoin is most undervalued relative to silver as a competing store of value.
We’re sitting on that line right now. The same signal that fired at every prior bear market bottom has just fired again.
Now, I want to be clear about what this means in the current context. Most wouldn’t consider Bitcoin to be in a “bear market” since January 2025 - after all, we’re still above the levels from a year ago. But the wave structure analysis I’ll show next suggests we’ve been in a larger-degree correction since early 2025. The Bitcoin/Silver signal reaching this level is consistent with that correction nearing its end.
Short-Term Scenarios
While the macro indicators point decisively higher over the coming months and years, the short-term picture presents two possible paths. Let me walk through each scenario and what to watch for confirmation.
Scenario 1: Running Flat Complete
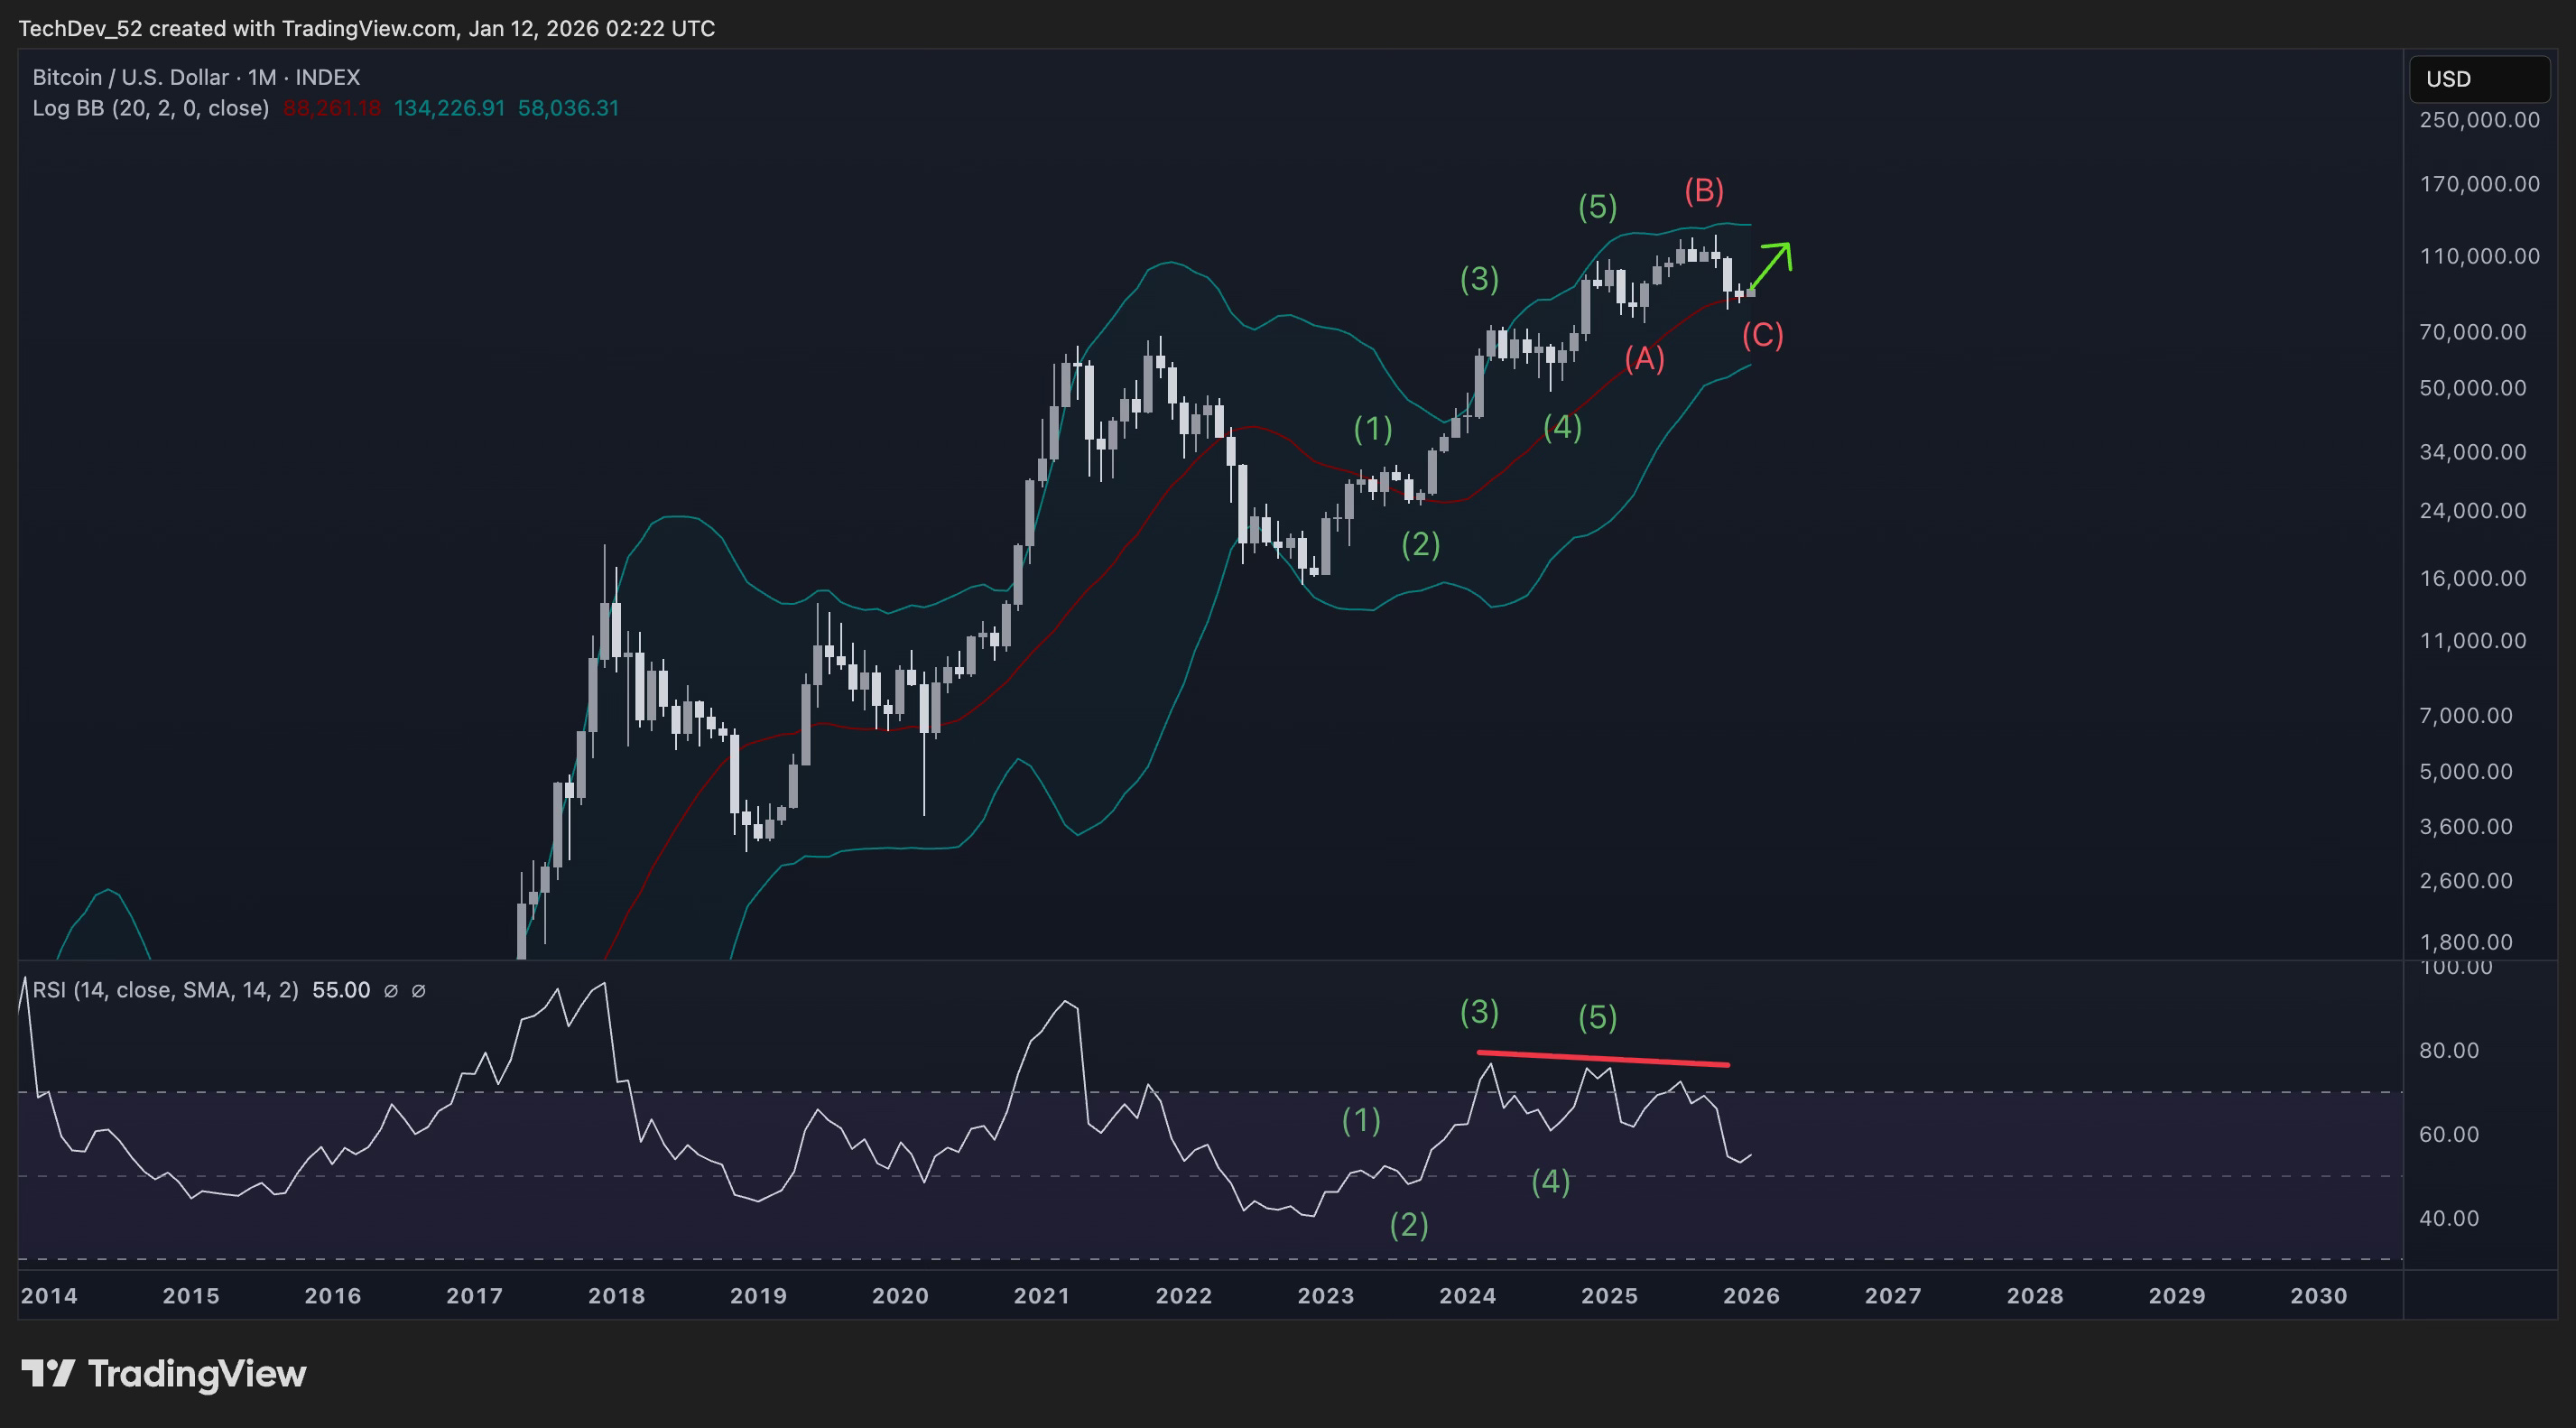
This chart shows my wave count since the 2022 bottom. The impulse from the lows completed a clear five-wave structure into early 2025, with the following characteristics:
Wave (3) peaked the RSI - this is typical behavior where the strongest wave produces the highest momentum
Wave (5) showed the first bearish divergence against wave (3) - again, typical for fifth waves
What I’m labeling as a (B) wave showed the second bearish divergence
Remember that bear markets are simply larger-degree corrections. The structure since the wave (5) high suggests we’ve been in an A-B-C corrective pattern.
In this first scenario, the (C) wave has already completed, forming what’s called a running flat - where the C-wave terminates above the A-wave low. The Bitcoin/Silver ratio bottoming could be lining up with this correction nearing its end.
If this scenario is correct, the macro bullish continuation has already begun.
Scenario 2: Expanded Flat with Final Leg
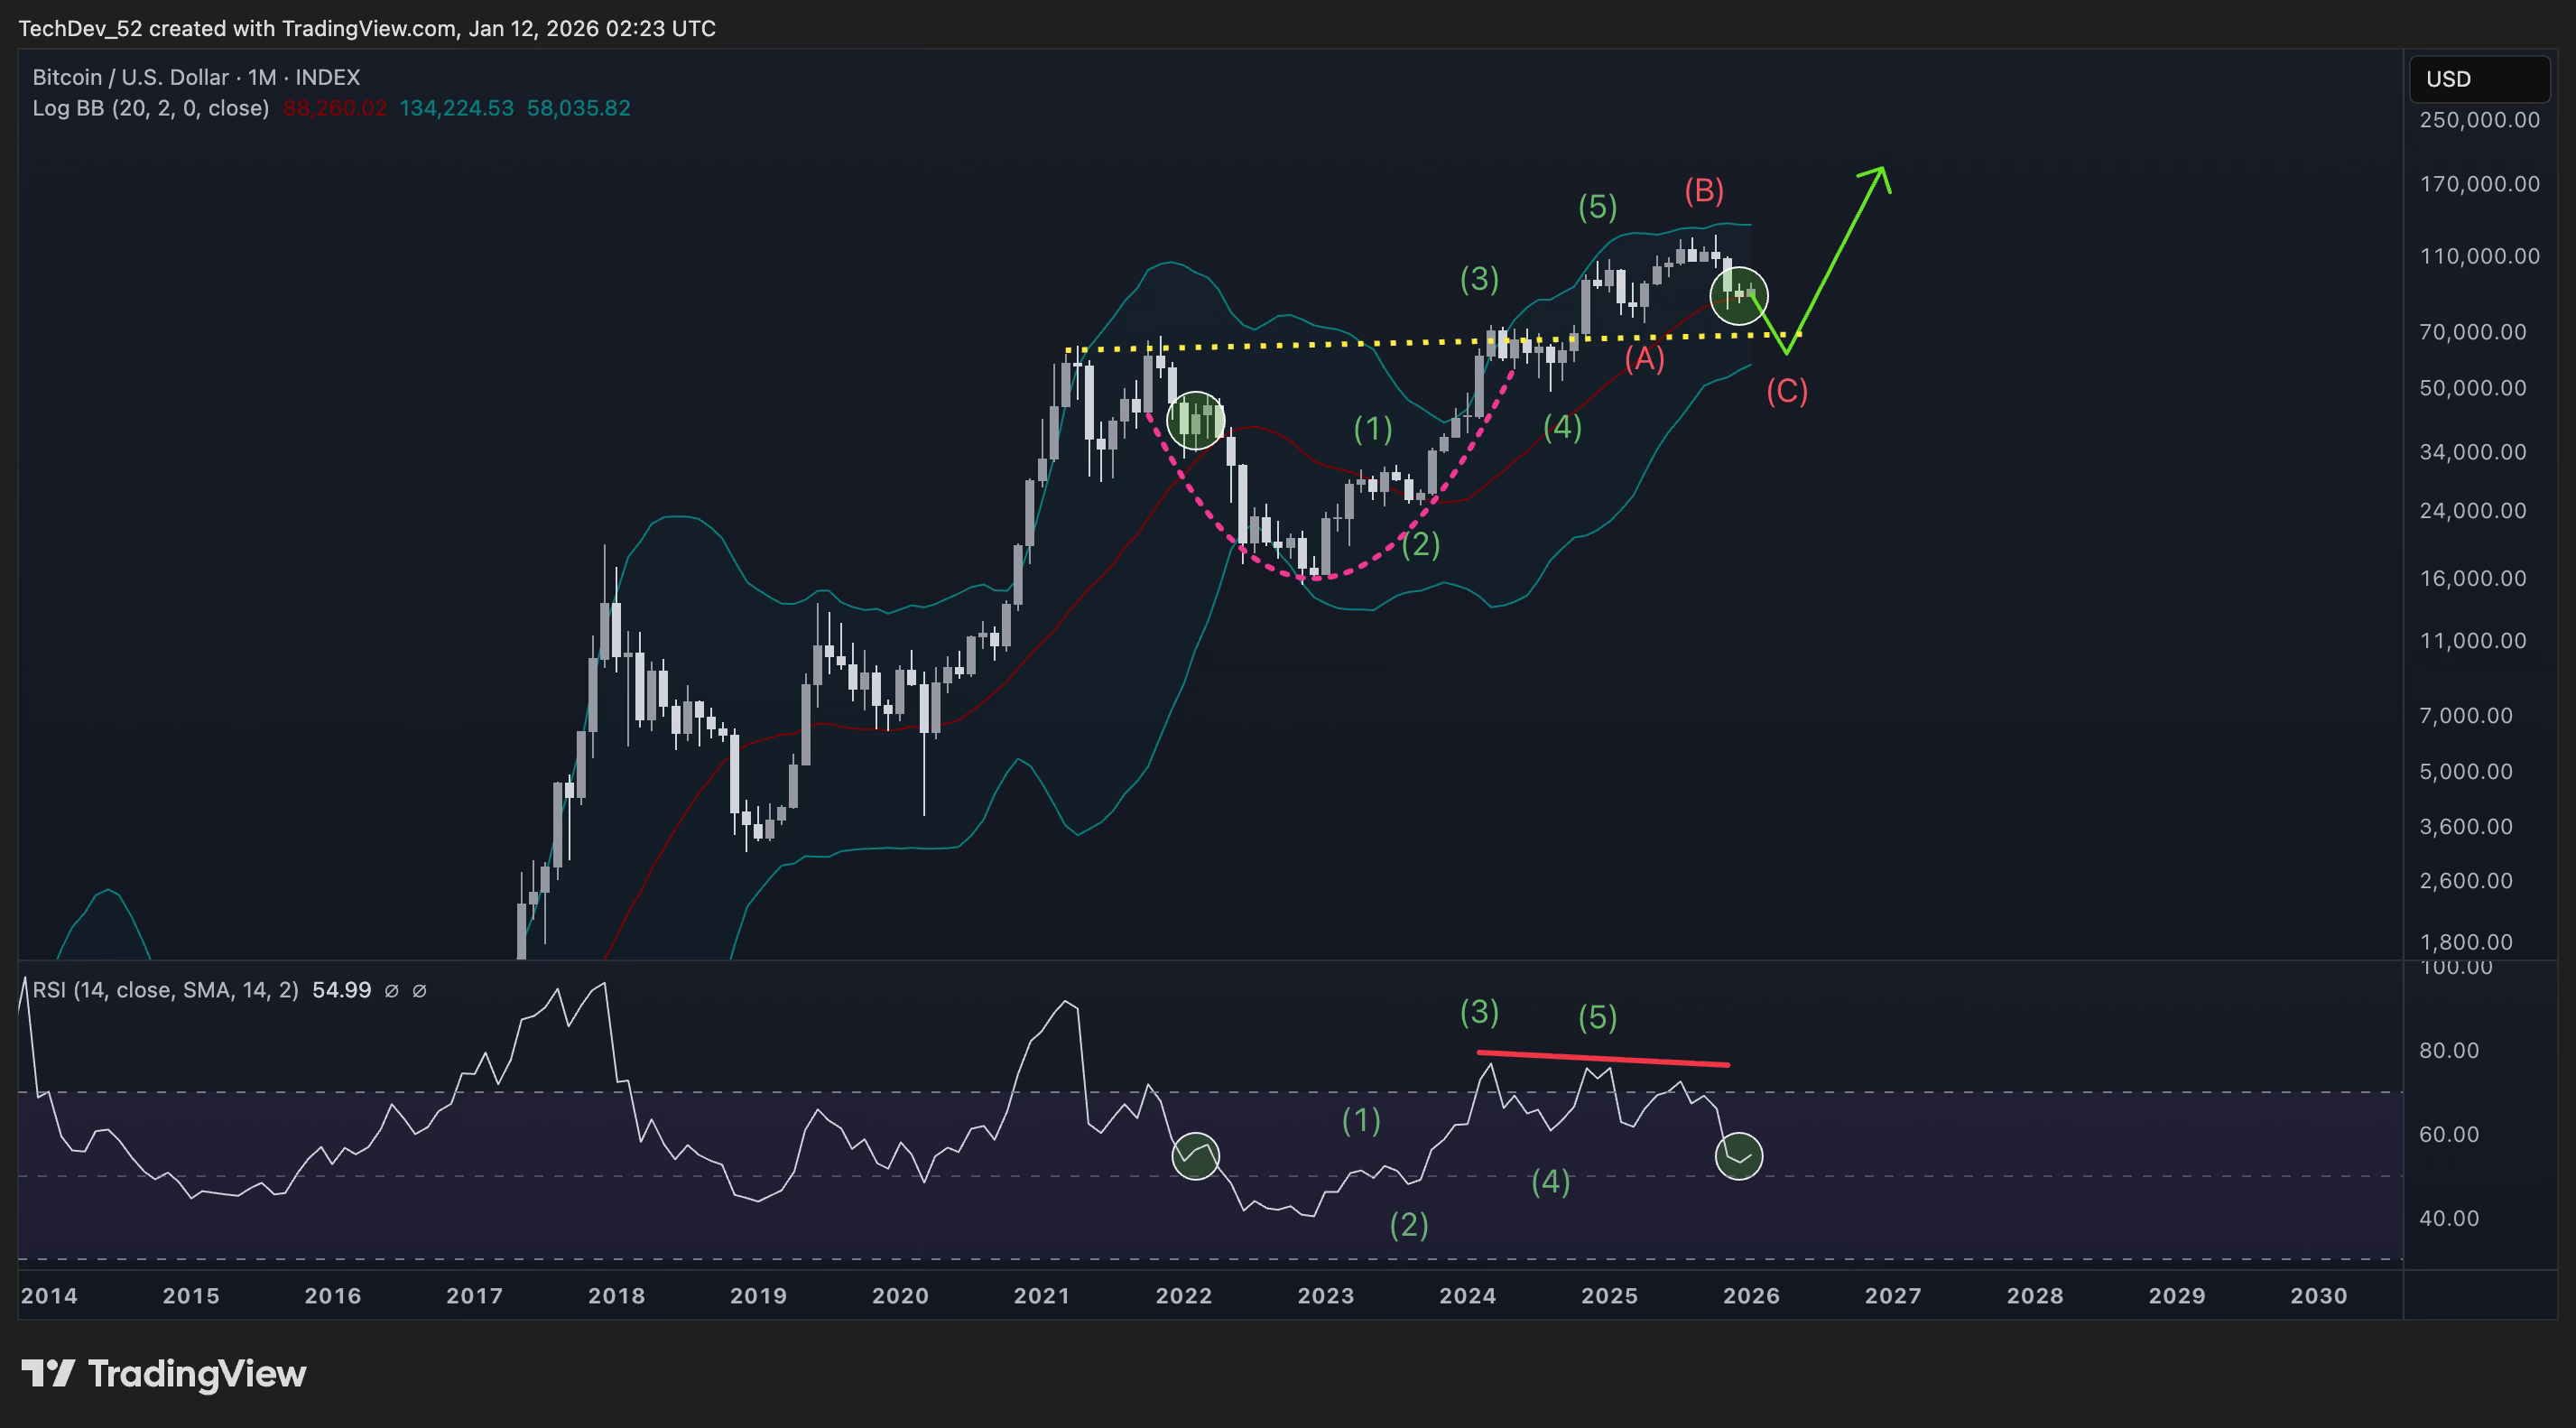
The second scenario must also be considered. Here, the monthly candles are sitting right on the Bollinger Band basis, with RSI at the same level as before the breakdown from the bear flag that led to the second C-leg in the 2021-2022 correction.
In this case, the (C) wave has another leg down, forming an expanded flat similar to the 2021-2022 structure. The pink path shows what this would look like - a corrective backtest of the macro cup-and-handle neckline before the larger advance begins.
Target for this leg would be around the 60K level.
I want to be clear: this scenario doesn’t change the macro view. The business cycle indicators, the leading signals from copper miners, the Bitcoin/Silver bottom signal - all of these point to the same conclusion regardless of whether we see another short-term leg down. The path to get there would simply be more volatile.
Key Levels to Watch
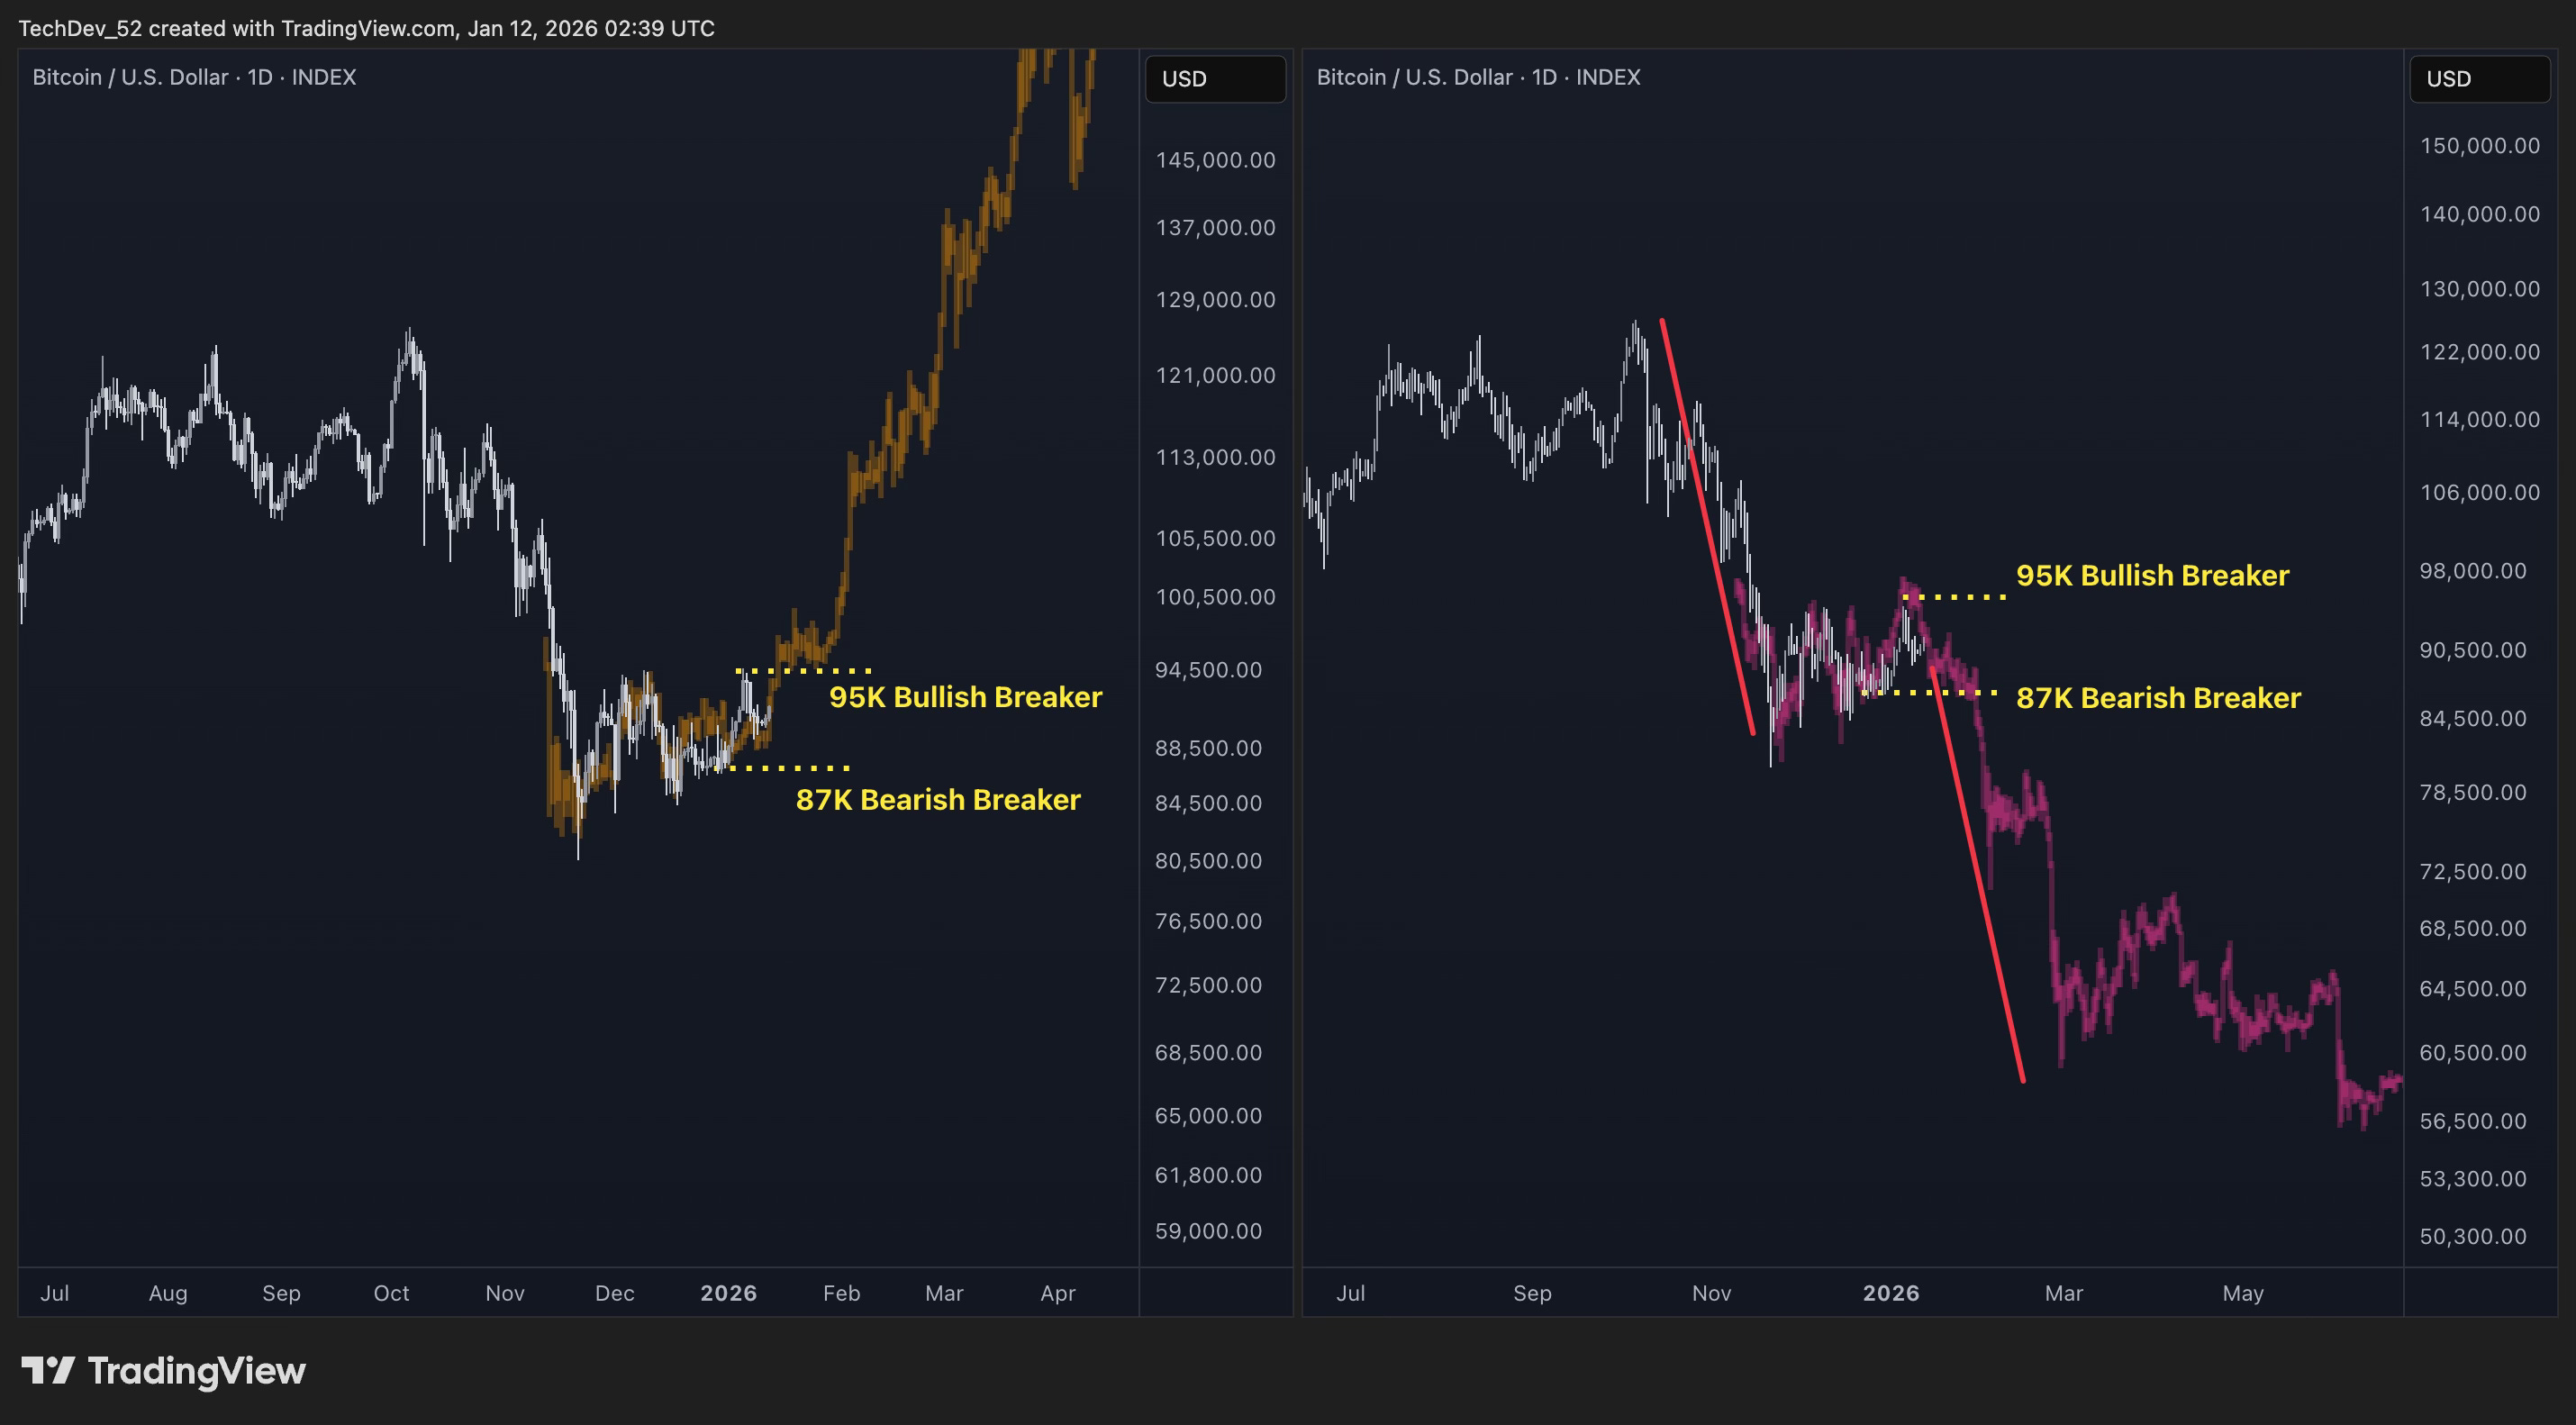
This lower timeframe view shows both scenarios side by side with the key levels for confirmation.
Bullish Scenario (Left Panel): If the correction has ended, we’re currently in local parabolic accumulation. I’m watching for a break and sustained hold above 95K as the bullish breaker that confirms this path. A decisive move above this level with follow-through would signal the correction is complete and the next leg higher has begun.
Bearish Scenario (Right Panel): If the correction has another leg, a break below 87K will serve as confirmation and mark the start of the final C-leg down. Target would be around the 60K level.
Though this second scenario would arguably lead to widespread panic in the short term, refer back to the macro charts for context. A dip to 60K would be quickly forgotten once the macro bullish continuation to follow kicks in. It would represent a deeper shakeout before the move that the business cycle indicators are signaling - not a change in the ultimate destination.
Closing
The concern about a 2008-style crash is understandable given the uncertainty in global markets. But the data tells a clear story: we’re positioned at the same business cycle levels as after the Great Recession, not before it.
The evidence stacks up:
Copper/Gold sitting on the bottoming line that has marked the end of every major economic contraction since 1999
Stochastic RSI showing the same reversal signature as the end of the Great Recession
Bullish divergence building to levels only seen once before - preceding a multi-year advance
Copper miners already reversing, providing the leading signal for the business cycle turn
COPX/Gold MACD cross firing at the same timing as October 2016 and October 2020
Bitcoin/Silver bottom indicator at the exact level that has marked every prior bear market bottom
The macro direction is clear to me. The only question is the short-term path.
Watch 95K as the bullish breaker. Watch 87K as the bearish confirmation. One of these levels will break first, telling us which scenario is unfolding.
Either way, what lies on the other side of this consolidation is the business cycle reversal that has preceded every major advance in Bitcoin’s history. The signals are in place. The reversal is approaching.
Next issue, I’ll present the altcoin structure analysis across different token chart characters.