Happy Holidays. Welcome to the 60th full issue of the TechDev Newsletter.
This is a special issue, which is going out to all subscribers.
As I’ve mentioned, I will be much less active on Twitter in the coming months, and am shifting most of my content delivery to Substack.
I’ve decided to break this publication into two streams:
#1 - Market Update Issues:
Will cover broad macro market updates on Bitcoin and altcoins, Bitcoin Top Gauge monitoring, equity market analysis when significant, and once we get confirmation of the next high timeframe impulse, longer-term altcoin targets. Most are similar to those in previous issues (just taking many months longer to reach), but they will be revisited.
As I always have, I will continue to provide my honest macro take on the market, right or wrong. The last 12 months have taught me a lot, and my goal over the last 6 especially has been to better position myself to scale out into the top of this next impulse, then wait to see the degree of the correction which follows.
Market Update Issues will be available exclusively to paid members.
Released on Sundays.
Members will receive both the Market Update AND Swing Trade Issues.
#2 - Swing Trade Issues:
Will review the signals and setups from the past week, bear and bull, on high and low timeframes.
See a backtest of the 3D BTC system here, and one of the 3D ETH system here.
Swing Trade Issues will be available to all subscribers.
Also released on Sundays.
For more info on the scope of this Substack publication, visit the about page here.
Today
As we wind down 2022, I wanted to come full circle and review the key market parameters I have been watching, as the primary indicators of where I believe 2023 is heading.
In this issue I will cover:
Market Update
This is the type of content to be included in the Market Update Issues going forward. Content specifics will vary with the market and altcoin targets will be added. Primary goal is to position for scaling out into next high timeframe impulse.
Correction since April 2021
Global liquidity cycle
Full crypto market view
Equity market position
Swing Trading
This is the type of content to be included in the Swing Trade Issues going forward. New setups will be introduced as they are found. Primary goal is to trade market both directions with a backtested system to manage risk, as a complement to a longer term buy-and-hold strategy.
BTC 3D signals
ETH 3D signals
High timeframe setups
Low timeframe setups
Thank you for reading, and for your support.
Bitcoin Top Gauge
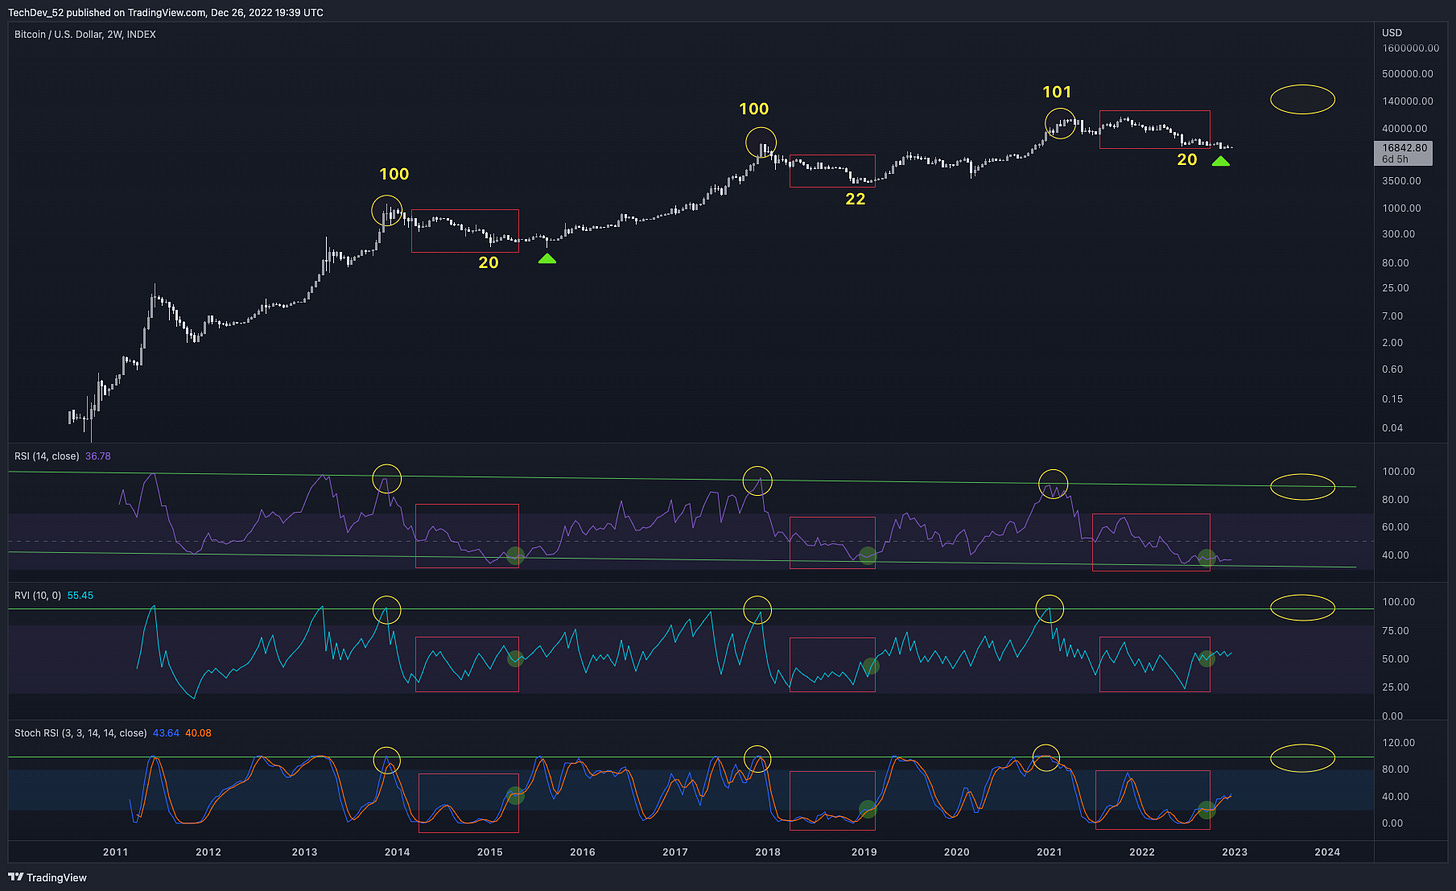
Today’s Top Gauge reading is 48.
The Top Gauge is holding steady in the 40s, as this 6 months of likely accumulation continues.
I’ll remind that the Gauge reached 100, 100, and 101, respectively, at each of the last 3 major impulse tops. While reaching 20 and 22 at each of the last 2 correction bottoms. A reading of 20 was reached in June. While we have a gone a couple K lower since, I still view 15-20K as the bottom region, where a bullish divergence between price and the Gauge has manifested as it did at the last 2 major bottoms.
On the indicators, we continue to see expected (if not boring) movement for this low volatility stage of the now 20-month correction.
RSI remains in the upper 30s, still hovering above the 12-year channel bottom after bouncing.
RVI still sits in the upper 50s as we want to see while continuing to grind up.
Stoch RSI is now beginning to spread once again following another bullish cross, also in line with what we were watching for.
Market Update
Correction Since April 2021
If you’ve been a subscriber to this newsletter, you know that since February, I have maintained the market “topped” Q2 of 2021 and has been in a corrective wave since.
2021 showed my true naiveté when it came to macro market structure, and I spent the first months of 2022 reforming my view from one obsessed with “cycle symmetry”, to one based around macro impulses and corrections.
I was wrong this year about the depth and length of this corrective wave, but have tried to take the opportunity to continue to DCA and grow my long-term positions. Key word here is opportunity. For now, none of my longer-term views and targets have been invalidated. I’ve only had the chance to strengthen my positions before they are reached.
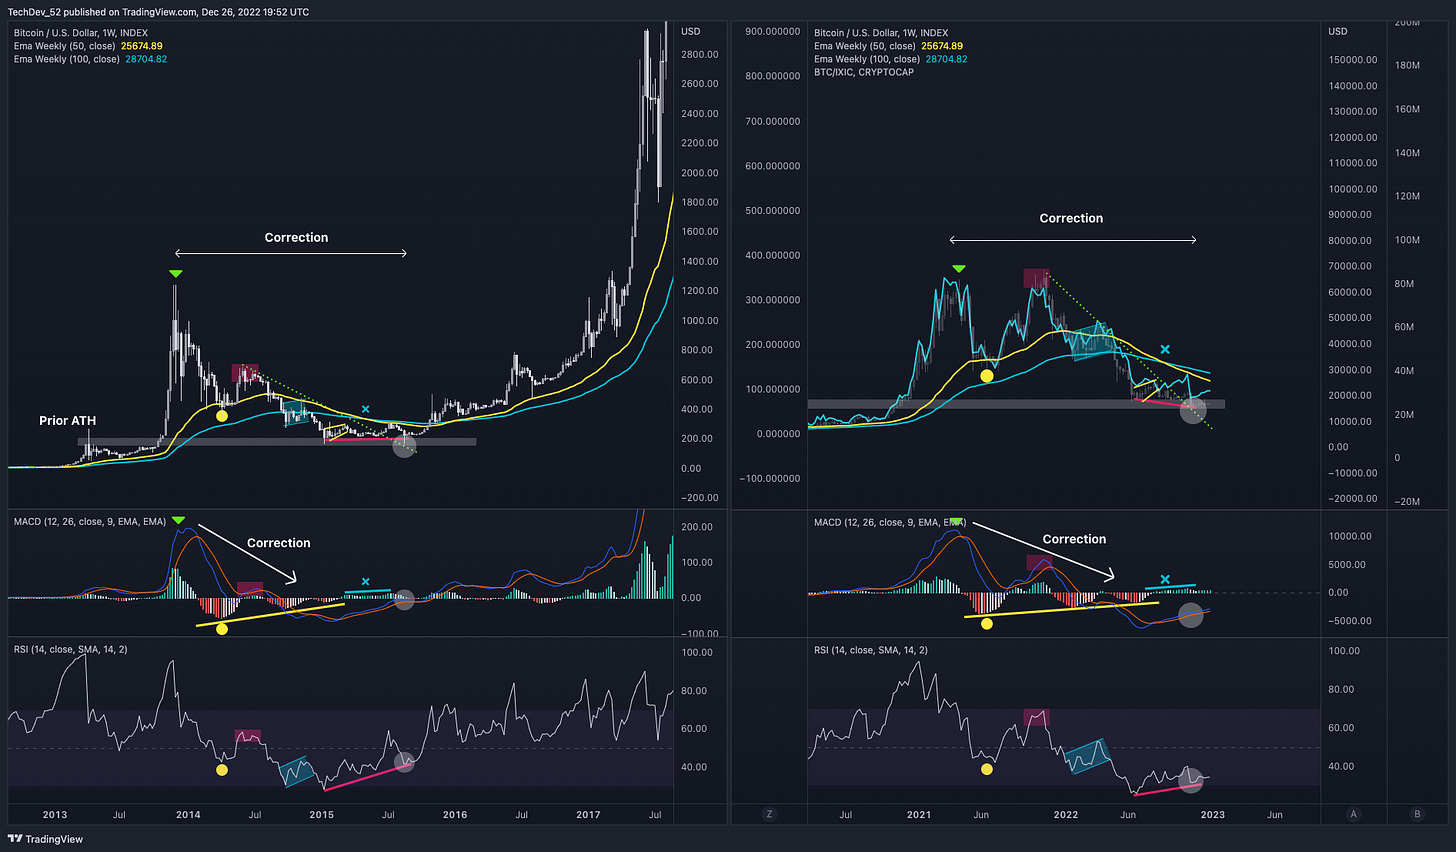
Below we look at a comparison we have monitored for some time. One between this 20-month Bitcoin corrective wave and the one which ran from 2014 to late 2015.
Much of social media is still preoccupied by the slightly higher-high of 69K, and does not seem to understand that corrective waves putting in new highs is actually quite common in all speculative markets. I was one that did not understand this in 2021, cheering the new ATH as proof “the cycle” was not over.
For all reasons shown in the below chart, I maintain Bitcoin (and the crypto market) has been correcting since April/May 2021.
Similar bounces and interactions with key 20/50/100 WEMAs
Declining weekly positive MACD histogram peaks with bullish negative histogram divergence
Declining weekly RSI with similar structure
Similar MACD and RSI structure (with local bull div) during this final accumulation period
Really the only difference between both structures is that this time we’ve put in a HH during the counter wave move (some call it the X-wave, some B-wave), versus a LH in 2015.
However, as I said, this is common in corrective waves, especially in equities, though it does not appear on the 📉 emoji.
Furthermore, there are plenty of assets in the crypto market which did print a LH in November, following a structure many seem more comfortable with. One example is Litecoin (shown in orange below).
Perhaps if Bitcoin’s top was similarly parabolic (rather than rounded distributive) 69K would have been a lower high and there would be no argument about when the “bear market” began.
Also take a look at Bitcoin (BTC) charted against the NASDAQ (IXIC) in blue below. No higher high in November 2021.
If you zoom out and review the full chart history (chart BLX/IXIC in TradingView), you’ll see peaks align between BLX/IXIC and all major BTC/USD impulse tops. I don’t believe this one is any exception. It’s just the first year+ Bitcoin corrective wave to print a “flat” structure, with X or B above the correction start.
We’ll be monitoring this chart for key weekly price closes as confirmation the next major impulse is underway.
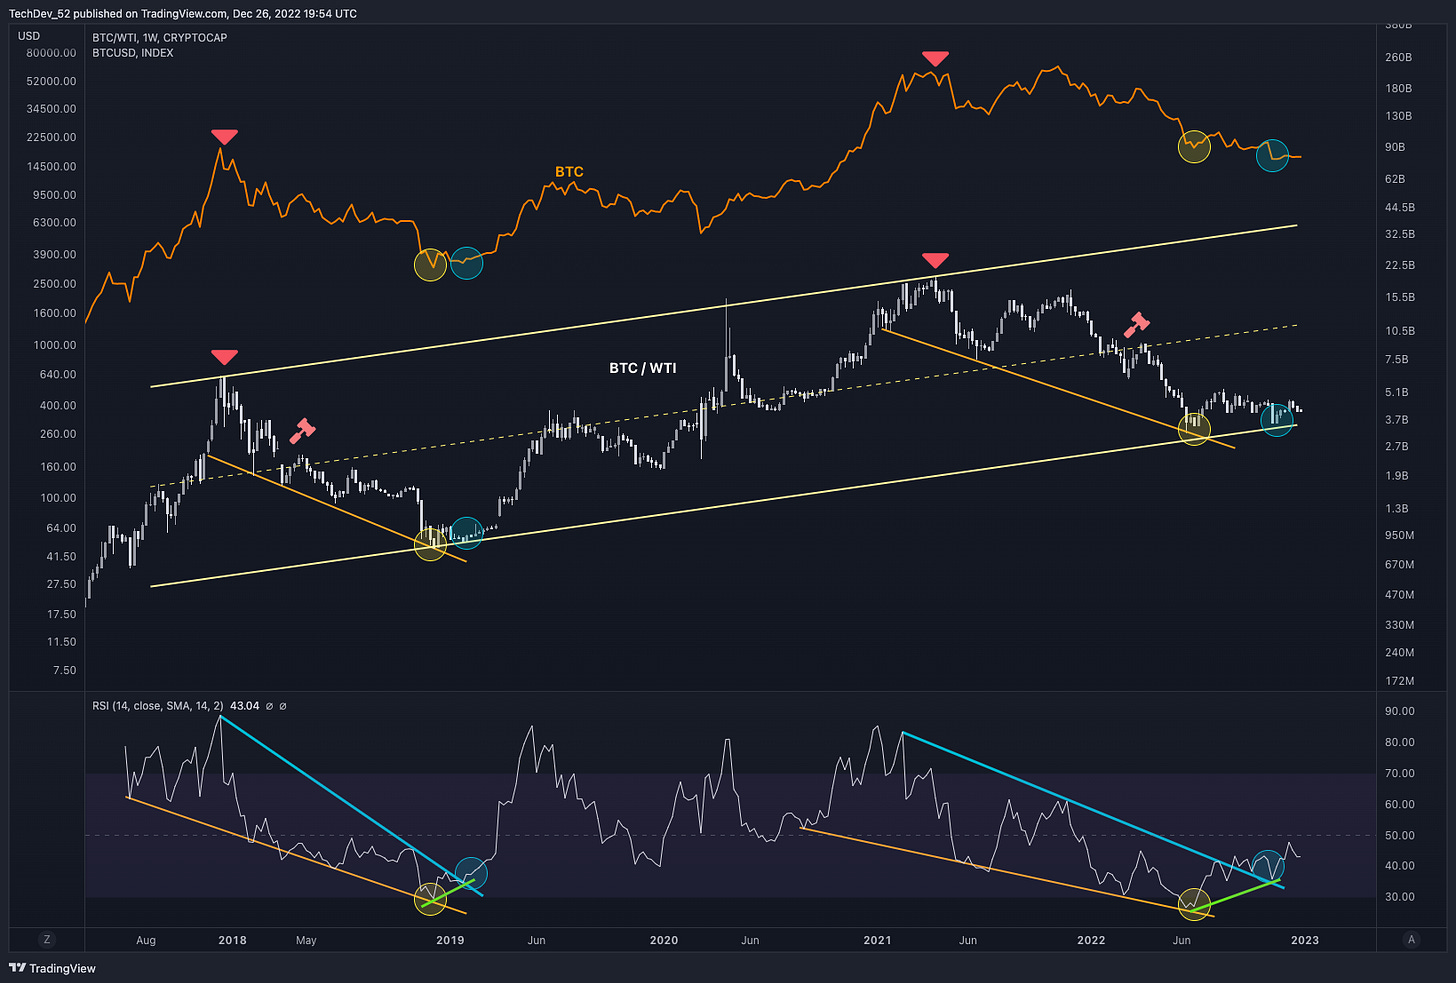
Finally, we can look at the chart of Bitcoin against crude oil (in other words, Bitcoin’s energy purchasing power).
Here we also see a “top” in April 2021, with the corrective wave that followed not too dissimilar to 2018-2019.
We’ve just recently reached channel bottom, with a similar bull div printing on the weekly RSI.
Subscribers may recall I mentioned this channel back in July, and highlighted that (at the time), we had not yet reached the true channel bottom, suggesting the pico BTC/USD bottom may not be in.
We’ll be monitoring this chart for channel invalidation, as well at upcoming HTF resistance/top indication.
Full Crypto Market View
Now let’s broaden our lens, and bring in other critical components to assessing the crypto market cycle state, rather than just Bitcoin.
We start with the altcoin market cap, where I view the market divided into a cyclical set of regions, Correction > Accumulation > Markup.
The below chart should indicate why I believe we’re in accumulation, and that markup is expected next.
It also serves as further evidence of the correction starting Q2 2021, breaking the local RSI uptrend just as the correction before.
Take note of where this accumulation bottom seems to be forming. Right on top of the prior ATH.
We’ve seen this before, which brings me to my full crypto market view, bringing in signals like Bitcoin dominance (BTC.D), dollar strength index (DXY), and Litecoin/Bitcoin (LTC/BTC).
Altcoin market cap sitting on top of its prior ATH after a long “flat” correction"
BTC.D below its 80W MA in what looks like bearish HTF redistribution ever since Q2 2021 (market “top”). We could see this break down from here, or we could see a short-term move higher to the 50% zone before the HTF move down, as was the case in early 2017.
DXY freshly broken down from a parabolic move off the same resistance (which we correctly anticipated from its 2-year weekly RSI trend break)
LTC/BTC recently breaking out from a falling wedge structure after a spring below
All 4 of these points together continue to suggest a broader market setup much closer to late 2016/early 2017 than any other prior position. It’s just taking 1.5-2x longer to develop, as has the rest of the structure thus far.
We’ll consistently monitor each of these 4-charts and their confluence for any major changes or invalidation of the broader market thesis.
Global Liquidity Cycle
The 4-year halving theory has regained popularity in the last year, and some find it impossible for Bitcoin to put in a ATH, much less a major top, before the next one halving event expected in April 2024.
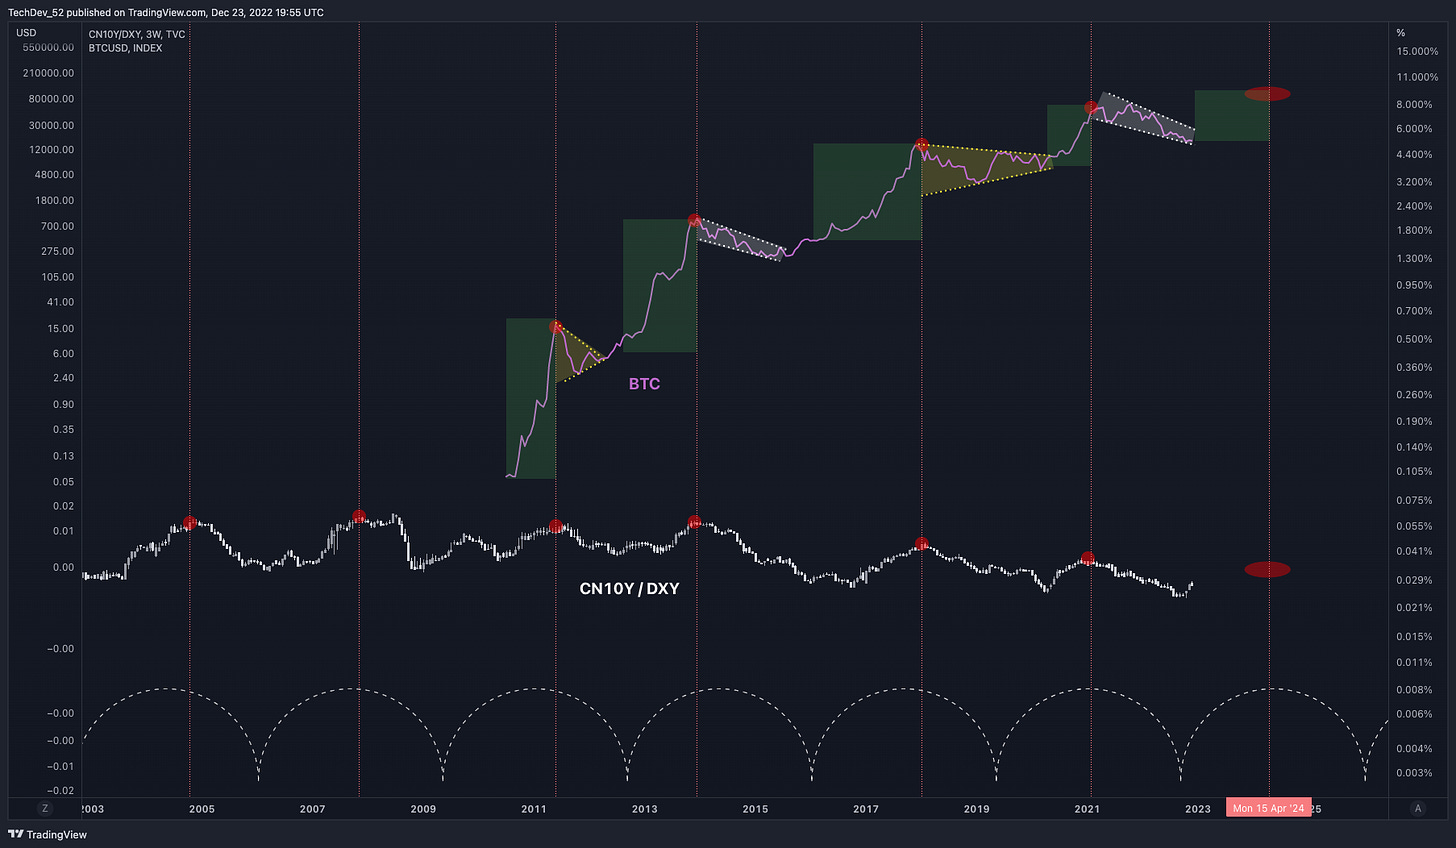
If there is any one “cycle” which Bitcoin has followed, I believe it more likely to be driven by the global liquidity, which China historically leads, and which is captured by charting Chinese 10-year bond yield (CN10Y) over DXY.
Note the clear cycle in this chart which has a peak-to-peak timing of roughly 3.4 years that has been printing long before Bitcoin existed.
Each local top in CN10Y/DXY marked or led a major impulse top in Bitcoin, and each local upside reversal marked or led the start of a major Bitcoin impulse.
Bringing it back to the prior broader market position theory of late 2016/early 2017, we see a liquidity cycle did begin mid-late 2016, further adding confluence (these cycles have led or marked major crypto market moves).
We’ll be keeping a close eye on this chart as well. Local tops have been steadily declining along a trendline since 2014, and its next hit could anticipate the next Bitcoin/crypto top. Cyclical timing over the last 20 years suggests this could be around the late 2023-mid 2024 timeframe.
I must say that a major top printing as a “sell-the-news” event near the April 2024 halving date would be quite ironic.
Equity Market Position
Some expect a major stock market crash, and rightly point to its historical crypto market correlation as reason for concern.
I’ve heard the arguments and seen the fractal comparisons to 2008.
But, when looking at the underlying data, see much more similarity to the mid-late 2016 period (once again).
Looking at the Dow Jones, note the:
Local price downtrend break and now backtest
Break above and now backtest of the 3W 20 EMA
Similar 3W RSI downtrend break with RSI over 50
200DMA breadth (% of stocks above their 200DMA) over 60%
During the lead up to the 2008 “crash”:
Price did not break the downtrend
Price did not reclaim the 3W 20MA
RSI did not break the downtrend
Breadth was nowhere close to 60
So, I do believe equities will also put in new highs next year.
While I do believe another correction will then begin late 2023 or early 2024, I am less confident as to the degree of it. Some believe it to rival 1929.
It may, but I intend to be out of all long-term positions at that time, and wait for the market to interact with key levels and trendlines before re-entering.
Going forward, we will revisit my two “rest-of-the-decade” scenarios I laid out previously.
Swing Trading
To follow these signals and setups live, or look for your own, the Dots and Trackline tools may be acquired at the TradingAlpha site, with the yearly Alpha Bundle.
BTC 3D Signals
See a 6-year backtest of the 3D BTC system here.
BTC is still in the 3D short from early December.
Current Trade: Short
Active From: 12/9/22
PNL: 1%
S/L: 10%
Would Close If: Red dots stop, or -40% PNL
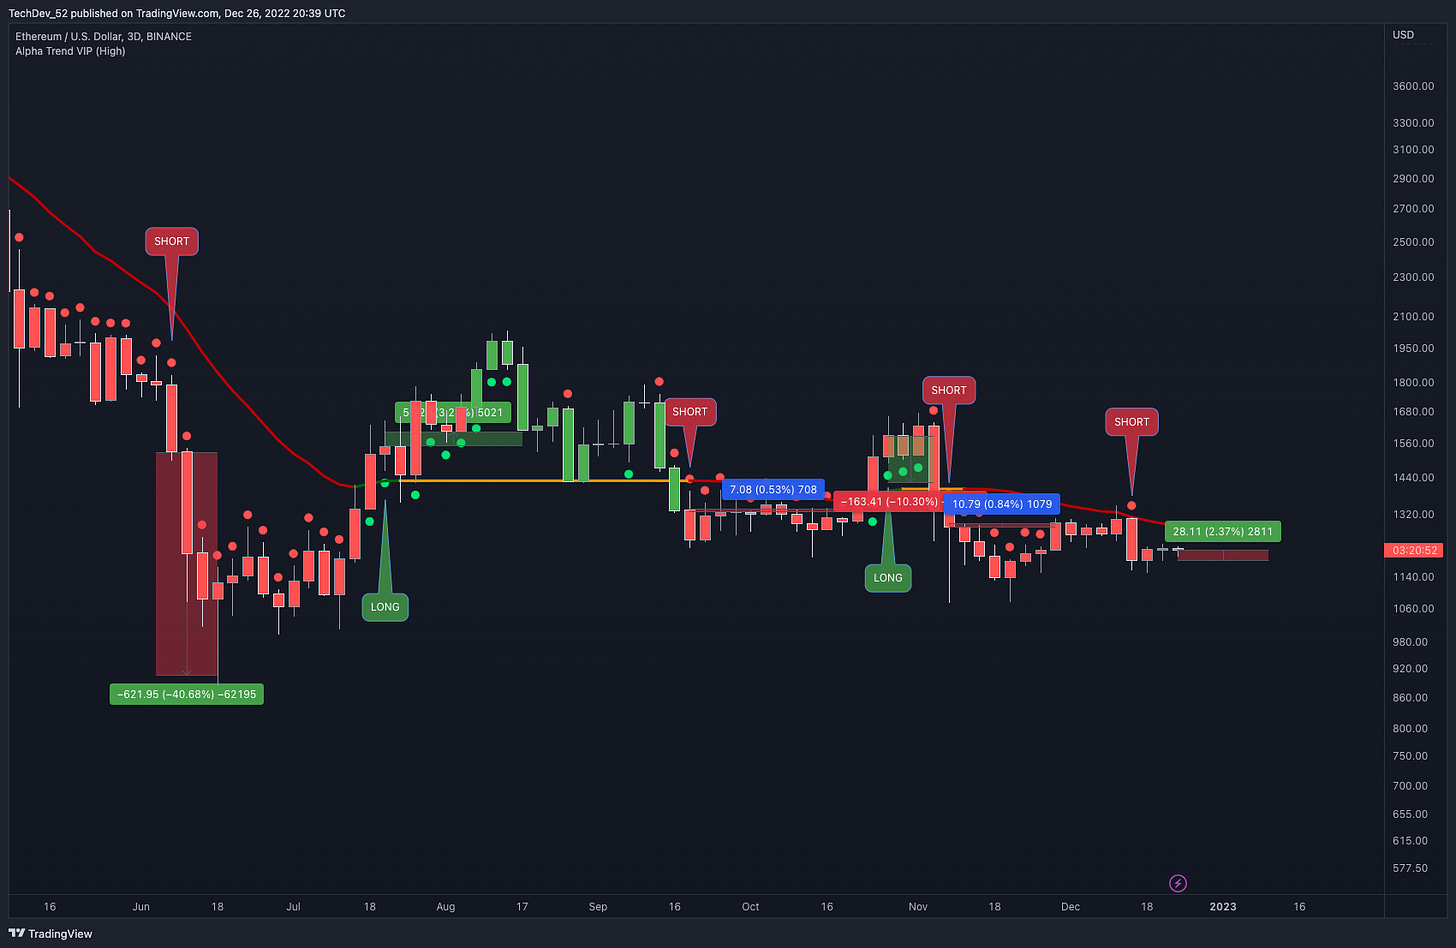
ETH 3D Signals
See a 6-year backtest of the 3D ETH system here.
ETH is still in its 3D short from mid December.
Current Trade: Short
Active From: 12/15/22
PNL: -2%
S/L: 10%
Would Close If: Red dots stop after at least 3 consecutive, or -40% PNL
High Timeframe Setups
TEL 1W
Current Trade: Long
Active Since: 11/21/22 (1 dot) or 12/5/22 (2 dots)
Current PNL: -9% (1 dot) or -29% (2 dots)
Would Close With: Close below trackline
Overall a poor trade thus far. However, I've mentioned consistently that as with any 1W setup, this is a high timeframe play.
It likely doesn't represent the best pico entry. Be prepared to hold through plenty of volatility along the way.
Example: last time green dot closed over trackline, trade didn't close for 6 months with candles never closing below trackline, during which time there were up to 60% swings on the way to a 5000% trade.
MATIC 1W
Possible Trade: Long
Would Open If: 1 or 2 dots above trackline (1 = higher risk, 2 = lower risk)
Would Close If: Green dots stop after at least 1 bounce off trackline, or close below trackline without at least 1 bounce.
TRIAS 5D
Current Trade: Long
Active Since: 11/7/22
Current PNL: -16%
Would Close With: Close below trackline
Similar notes to TEL. It doesn't represent the best pico entry. Be prepared to hold through plenty of volatility along the way.
Low Timeframe Setups
ETH 12H
See below for recent trade history.
Last issue, entry criteria for LTF was adjusted to a single dot above/below trackline, which would have made the last trade a break-even.
Possible Trade: Long
Would Open If: 1 green dot above trackline
Would Close If: Green dots stop after at least 3 consecutive
S/L: 5%
Possible Trade: Short
Would Open If: Red dots resume
Would Close If: Red dots stop after at least 3 consecutive, or 40% PNL
S/L: 5%
DOGE 12H
See below for recent trade history. Latest trade was a won short for 17% PNL.
Current Trade: Short
Active Since: 12/25/22
S/L: 6%
Current PNL: 2%
Would Close With: Red dots stop
Possible Trade: Long
Would Open If: 1 green dot above trackline
Would Close If: Green dots stop after at least 3 consecutive
S/L: 6%
To follow these signals and setups live, or look for your own, the Dots and Trackline tools may be acquired at the TradingAlpha site, with the yearly Alpha Bundle.
Closing Thoughts
Today was a special issue, which went out to all subscribers.
I will be much less active on Twitter in the coming months, and am shifting most of my content delivery to Substack.
This publication will be broken into two streams:
#1 - Market Update Issues:
Will cover broad macro market updates on Bitcoin and altcoins, Bitcoin Top Gauge monitoring, equity market analysis when significant, and once we get confirmation of the next high timeframe impulse, longer-term altcoin targets.
Market Update Issues will be available exclusively to paid members.
Released on Sundays.
Members will receive both the Market Update AND Swing Trade Issues.
#2 - Swing Trade Issues:
Will review the signals and setups from the past week, bear and bull, on high and low timeframes.
See a backtest of the 3D BTC system here, and one of the 3D ETH system here.
Swing Trade Issues will be available to all subscribers.
Also released on Sundays.
For more info on the scope of this Substack publication, visit the about page here.
Thank you to the thousands of paid members and tens of thousands of subscribers who have continued to support and read my content every week.
I am committed to always sharing my honest takes, right or wrong, and they are the very same opinions I invest in myself.
Wishing you all a prosperous 2023.










The chart under 'Global Liquidity Cycle' charting Chinese 10-year bond yield (CN10Y) over DXY is an eye opener!! 10/10 news letter